"A credit card is a payment card issued to users as a system of payment. It allows the cardholder to pay for goods and services based on the holder's promise to pay for them. The issuer of the card creates a revolving account and grants a line of credit to the consumer (or the user) from which the user can borrow money for payment to a merchant or as a cash advance to the user." [Credit card. Wikipedia]
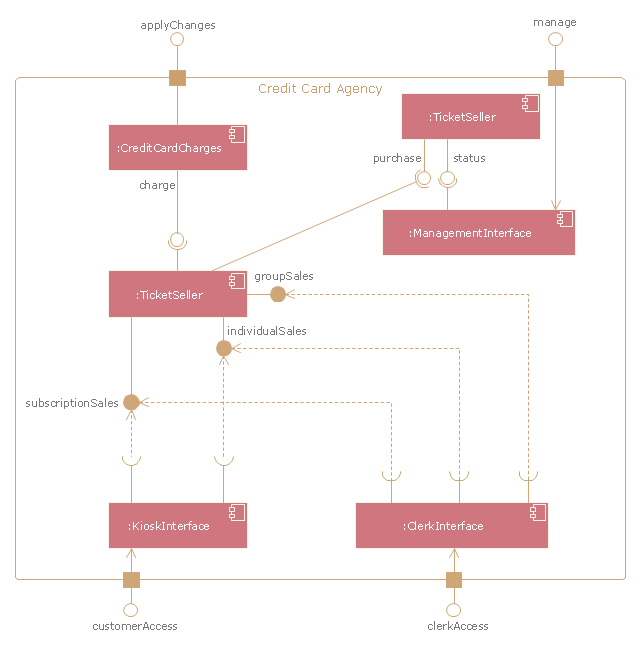
The UML component diagram example "Credit card agency" was created using the ConceptDraw PRO diagramming and vector drawing software extended with the Rapid UML solution from the Software Development area of ConceptDraw Solution Park.
The UML component diagram example "Credit card agency" was created using the ConceptDraw PRO diagramming and vector drawing software extended with the Rapid UML solution from the Software Development area of ConceptDraw Solution Park.
UML component diagram
 Fishbone Diagram
Fishbone Diagrams solution extends ConceptDraw PRO software with templates, samples and library of vector stencils for drawing the Ishikawa diagrams for cause and effect analysis.
 Event-driven Process Chain Diagrams
Event-driven Process Chain (EPC) Diagram is a type of flowchart widely used for modeling in business engineering and reengineering, business process improvement, and analysis. EPC method was developed within the Architecture of Integrated Information Systems (ARIS) framework.
 AWS Architecture Diagrams
The flexible AWS cloud solutions will help you to create reliable applications with a high level of scaling in the AWS cloud, to run your applications and accelerate their work on the level of security. Besides AWS resources are available worldwide and yo
 Venn Diagrams
Venn Diagrams are actively used to illustrate simple set relationships in set theory and probability theory, logic and statistics, mathematics and computer science, linguistics, sociology, and marketing. Venn Diagrams are also often used to visually summarize the status and future viability of a project.
 Circle-Spoke Diagrams
Examples of subject areas that are well suited to this approach are marketing, business, products promotion, process modeling, market, resource, time, and cost analysis. Circle-Spoke Diagrams are successfully used in presentations, conferences, management documents, magazines, reportages, reviews, reports, TV, and social media.
 Entity-Relationship Diagram (ERD)
Entity-Relationship Diagram (ERD) solution extends ConceptDraw PRO software with templates, samples and libraries of vector stencils from drawing the ER-diagrams by Chen's and crow’s foot notations.
 Telecommunication Network Diagrams
Telecommunication Network Diagrams solution extends ConceptDraw PRO software with samples, templates, and great collection of vector stencils to help the specialists in a field of networks and telecommunications, as well as other users to create Computer systems networking and Telecommunication network diagrams for various fields, to organize the work of call centers, to design the GPRS networks and GPS navigational systems, mobile, satellite and hybrid communication networks, to construct the mobile TV networks and wireless broadband networks.
- Diagramming Software for Design UML Component Diagrams | UML ...
- Uml Component Diagram
- UML Diagrams with ConceptDraw PRO | UML Component Diagram ...
- UML Component Diagram Example - Online Shopping | UML ...
- UML Component Diagram | Diagramming Software for Design UML ...
- UML component diagram - Credit card agency | Rapid UML | Rapid ...
- UML Component Diagram
- Pdf For How To Draw Component Diagram
- UML Tool & UML Diagram Examples | UML Component Diagram ...
- Credit Card Processing System UML Diagram | Credit Card Order ...
- Credit Card Processing System UML Diagram | UML in 10 mins ...
- UML Component Diagram Example - Online Shopping | UML ...
- UML Component Diagram Example - Online Shopping | Example of ...
- UML Activity Diagram | Diagramming Software for Design UML ...
- State Diagram Example - Online Store | Engineering | Credit Card ...
- UML Deployment Diagram Example - ATM System UML diagrams ...
- UML Activity Diagram | Diagramming Software for Design UML ...
- Credit Card Processing System UML Diagram | UML in 10 mins ...
- Process Flowchart | UML Activity Diagram . Design Elements | UML ...
- Draw An Activity Diagram Using Staruml For The Credit Card ...