HelpDesk
How to Draw a Pie Chart Using ConceptDraw PRO
A pie chart represents data, in a clear and easy to read round (pie) form. A circular pie chart is divided into sections (slice). Each "slice" depicts the It reflects the proportion of each component in the whole "pie". This type of chart is most often used for the visualization of statistical data. That is why pie charts are widely used in marketing. As pie charts show proportional proportional parts of a whole, they are good for various visual comparisons. For example, it is difficult to imagine a more intuitive way to show segmentation and market share. ConceptDraw PRO allows you to draw a simple and clear Pie Chart using the Pie Charts solution.Data structure diagram with ConceptDraw PRO
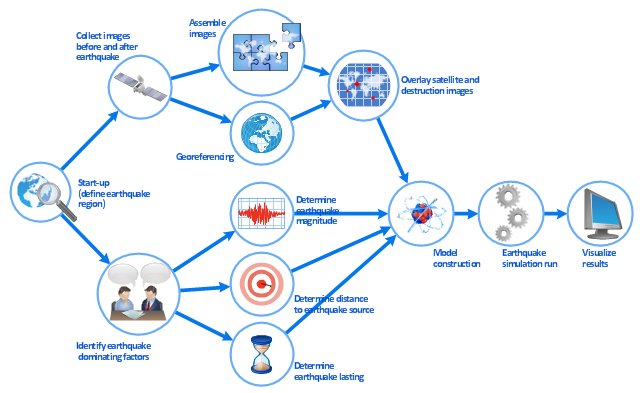
Data structure diagram (DSD) is intended for description of conceptual models of data (concepts and connections between them) in the graphic format for more obviousness. Data structure diagram includes entities description, connections between them and obligatory conditions and requirements which connect them. Create Data structure diagram with ConceptDraw PRO.This work flow chart sample was redesigned from the picture "Simulation for earthquake disaster assessment" from the article "Simulation Workflows".
[iaas.uni-stuttgart.de/ forschung/ projects/ simtech/ sim-workflows.php]
" This simulation was developed to have an in depth understanding of the destructions and the decisions to be made in various phases of crisis management (Source: Mahdi Hashemi and Ali A. Alesheikh (2010). "Developing an agent based simulation model for earthquakes in the context of SDI." GSDI 12 World Conference. 19 – 22 October 2010. Singapour). The simulation process contains following major steps:
(1) All spatial information including satellite images (before and after the earthquake) and topographic/ cadastral maps of the area are mosaicked and georeferenced. The parts of the city that contain various levels of destructions are selected. Three types of features namely buildings, roads and recreational areas are classified and extracted from the satellite images.
(2) The governing factors of destructions are identified; a mathematical model that integrates the factors is constructed.
(3) The simulation is constructed for various parameter values (different earthquake strength, time elapses, etc.)" [iaas.uni-stuttgart.de/ forschung/ projects/ simtech/ sim-workflows.php]
The example "Workflow diagram - Earthquake disaster assessment" was drawn using the ConceptDraw PRO diagramming and vector drawing software extended with the Workflow Diagrams solution from the Business Processes area of ConceptDraw Solution Park.
- Draw A Flow Chart Of Classification Of Wine
- Draw Flow Chart Showing Classification Of Mineral
- Drawing Of Flow Chart On Natural Resources Classification
- Types of Welding in Flowchart | Entity Relationship Diagram ...
- Flow Chart On Classification Of Resources
- Types of Welding in Flowchart | Entity Relationship Diagram ...
- Draw A Flow Chart Representing The Classification Of Industries
- Flowchart Of Classification Of Natural Resources With Examples
- Draw A Flowchart Showing Classification Of Resources
- Draw A Flow Chart Diagram On Classification Of Resources
- Draw A Flow Chart Of Classification Of Different Source Of Energy
- Hotel Plan. Hotel Plan Examples | Flow Chart On Classification Of ...
- Classification Of Transports In Flow Chart
- Draw A Flow Diagram Of Classification Of Communication
- Types of Welding in Flowchart | Computer Network Diagrams | Entity ...
- Types of Welding in Flowchart | Entity Relationship Diagram ...
- Marketing Classification Flow Chart
- Draw A Classification Chart
- Types of Welding in Flowchart | Entity Relationship Diagram ...
- Classification Of Natural Resources With Flow Chart Pdf


