Energy Pyramid Diagram
Energy Pyramid Diagram is a visual graphical representation of the biomass productivity on the each trophic level in a given ecosystem. Its designing in ConceptDraw PRO will not take much time thanks to the unique Pyramid Diagrams solution from the Marketing area of ConceptDraw Solution Park. Energy Pyramid Diagram begins from the producers (plants) and proceeds through a few trophic levels of consumers (herbivores which eat these plants, the carnivores which eat these herbivores, then carnivores which eat those carnivores, and so on) to the top of the food chain.Bubble Plot
This sample was created in ConceptDraw PRO diagramming and vector drawing software using the Bubble Diagrams Solution from the ConceptDraw Solution Park. This sample shows the BCG (Boston Consulting Group) matrix that is used in marketing and product management for strategic analysis and planning.
 Area Charts
Area Charts are used to display the cumulative totals over time using numbers or percentages; or to show trends over time among related attributes. The Area Chart is effective when comparing two or more quantities. Each series of data is typically represented with a different color, the use of color transparency in an object’s transparency shows overlapped areas and smaller areas hidden behind larger areas.
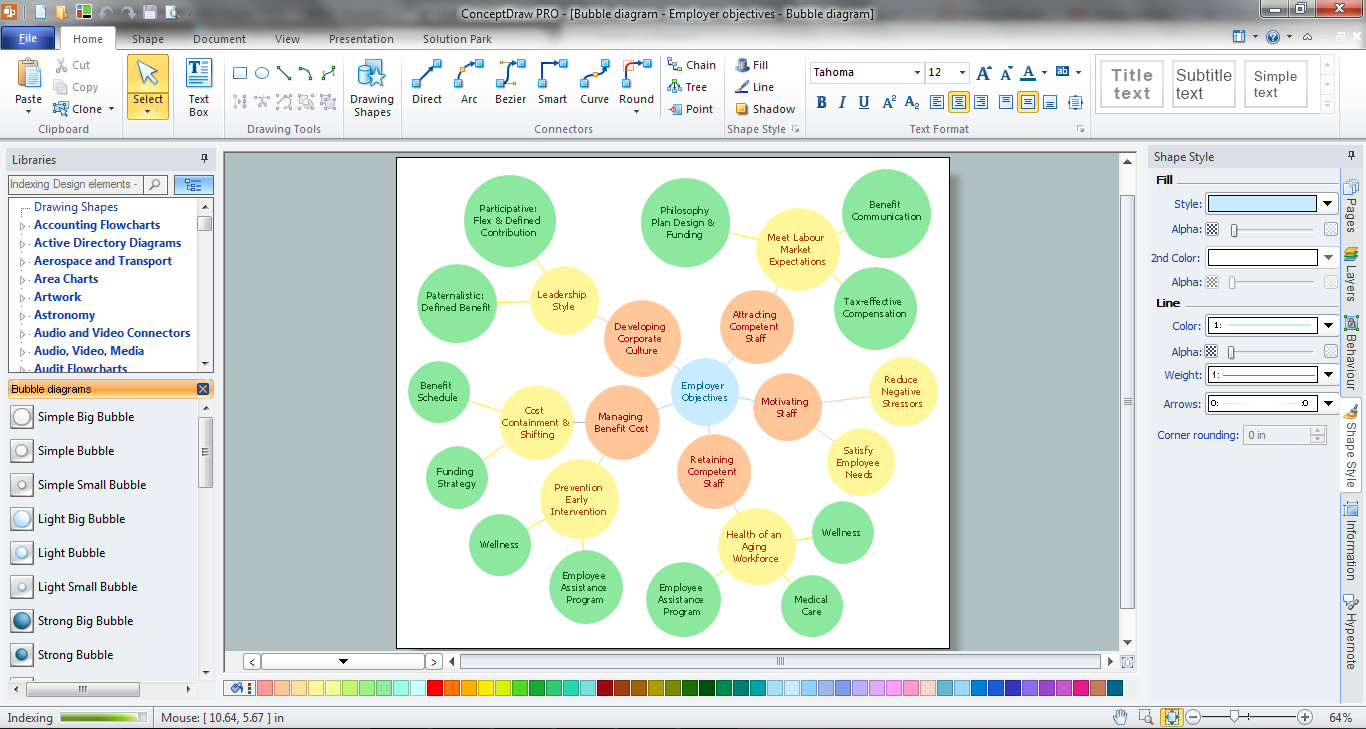
Bubble Chart Maker
ConceptDraw PRO diagramming and vector drawing software extended with Bubble Diagrams Solution from the "What is a Diagram" Area is a powerful Bubble Chart Maker.- Scatter Chart Examples | Bubble Plot | Four Dimensions Bubble Plot ...
- Competitor Analysis | Process Flowchart | Pyramid Chart Examples ...
- Resources and energy - Vector stencils library | Energy Pyramid ...
- Pyramid Diagram | Process Flowchart | GUI Prototyping with ...
- How to Create a Social Media DFD Flowchart | Pyramid Diagrams ...
- Ecosystem goods and services - Segmented pyramid diagram ...
- Design elements - Stratification diagram | Stratification diagram ...
- Four Dimensions Bubble Plot | Chart Maker for Presentations ...
- Service-goods continuum diagram | Process Flowchart | How To ...
- Manufacturing and Maintenance | Pie Charts | Divided Bar Diagrams ...
- Scatter Chart Analysis. Scatter Chart Example | Scatter Chart ...
- Path to sustainable development | Bar Diagrams for Problem ...
- Venn Diagram Examples for Problem Solving. Environmental Social ...
- Resources and energy - Vector stencils library | Manufacturing and ...
- USA Maps | Circle-Spoke Diagrams | Area Charts | Diagram ...
- Resources and energy - Vector stencils library | Energy resources ...
- Social media activity of a real estate agent | Work Order Process ...
- Bubble Map Maker | Bubble Chart Maker | Bubble Chart | Bubble ...
- Bar Diagrams for Problem Solving. Create space science bar charts ...
- Bubble diagrams in Landscape Design with ConceptDraw PRO ...


