HelpDesk
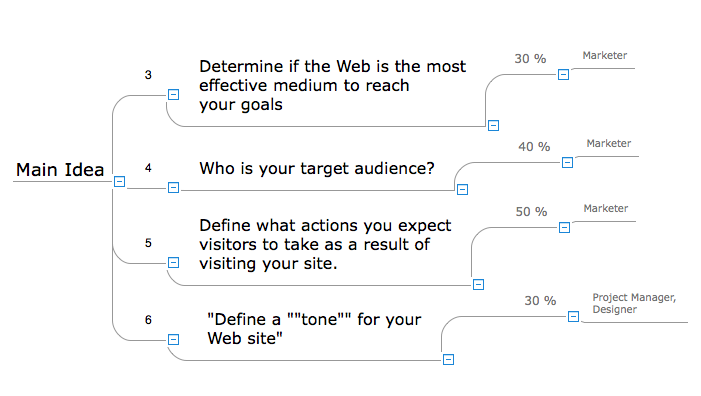
How to Input Data from MS Excel Into a Mind Map
 ConceptDraw Dashboard for Facebook
ConceptDraw Dashboard for Facebook solution extends ConceptDraw DIAGRAM software with a dynamically updated visual dashboard, which shows lifetime total likes, daily friends of fans, and daily page views, information you can receive from Facebook Insights.
HelpDesk
How to Make Business Intelligence Dashboard
HelpDesk
How To Create an HR Metric Dashboard

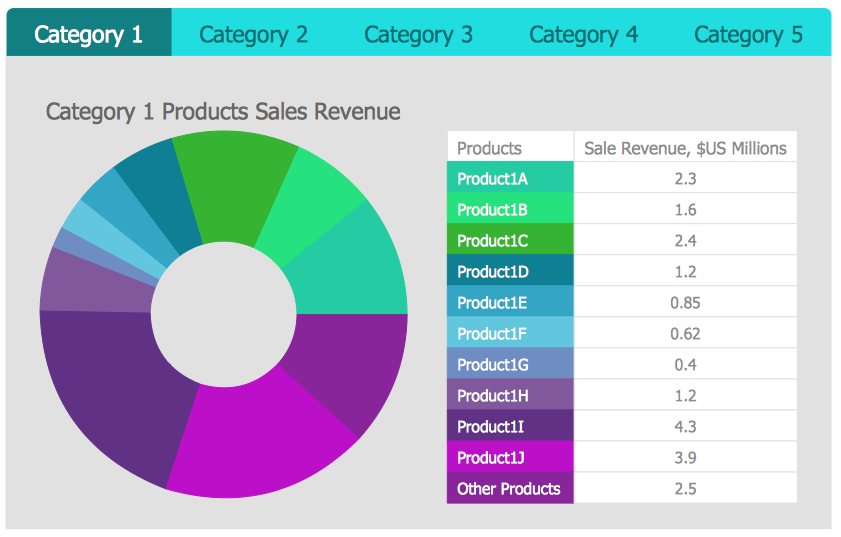
 Sales Dashboard
Sales Dashboard solution extends ConceptDraw DIAGRAM software with templates, samples and library of vector stencils for drawing the visual dashboards of sale metrics and key performance indicators (KPI).
HelpDesk
How To Create a CRM System Dashboard
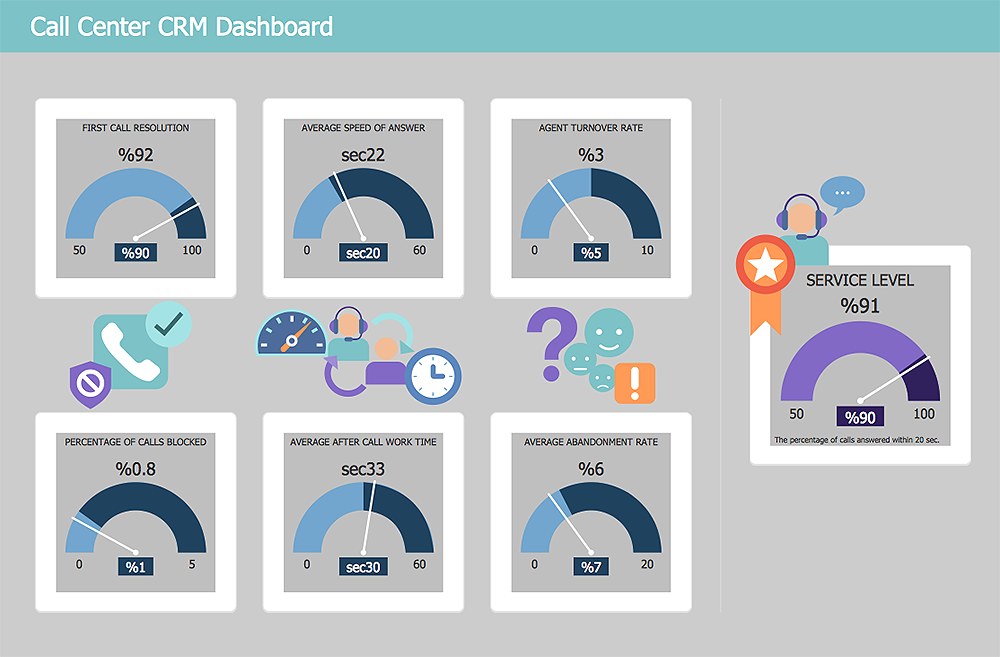
Performance Indicators

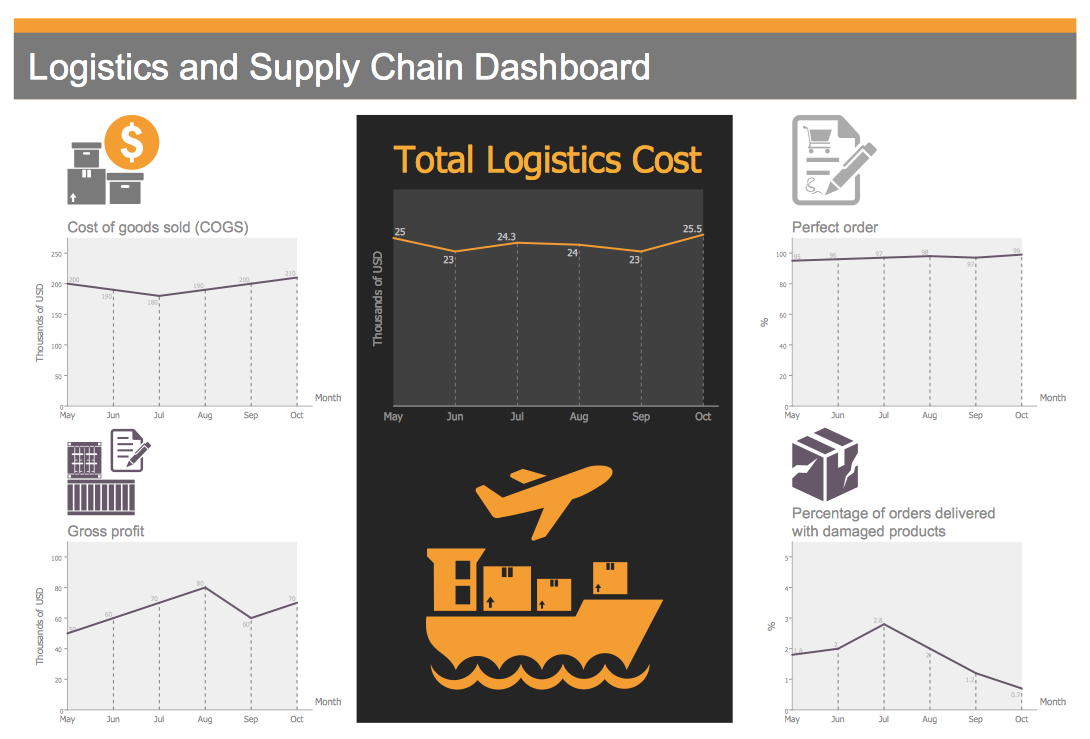
HelpDesk
How to Make a Logistic Dashboard
- Process Mapping Template Xls
- Business Process Reengineering Cycle Diagram Xls
- Workflow Spreadsheet Template
- Quality Function Deployment Example Xls
- SWOT Matrix Template | How To Create an HR Metric Dashboard ...
- Process Flow Chart Template Xls
- Process Flowchart | Cross-Functional Flowchart | Functional Flow ...
- Flowchart Software | Flow chart Example. Warehouse Flowchart ...
- Flowchart Software | Business Process Flow Diagram | Process Flow ...
- Pert Chart Spreadsheet Excel