"The symbols and conventions used in welding documentation are specified in national and international standards such as ISO 2553 Welded, brazed and soldered joints -- Symbolic representation on drawings and ISO 4063 Welding and allied processes -- Nomenclature of processes and reference numbers. The US standard symbols are outlined by the American National Standards Institute and the American Welding Society and are noted as "ANSI/ AWS".
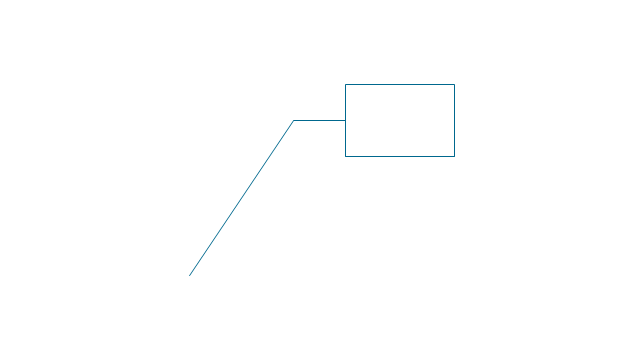
In engineering drawings, each weld is conventionally identified by an arrow which points to the joint to be welded. The arrow is annotated with letters, numbers and symbols which indicate the exact specification of the weld. In complex applications, such as those involving alloys other than mild steel, more information may be called for than can comfortably be indicated using the symbols alone. Annotations are used in these cases." [Symbols and conventions used in welding documentation. Wikipedia]
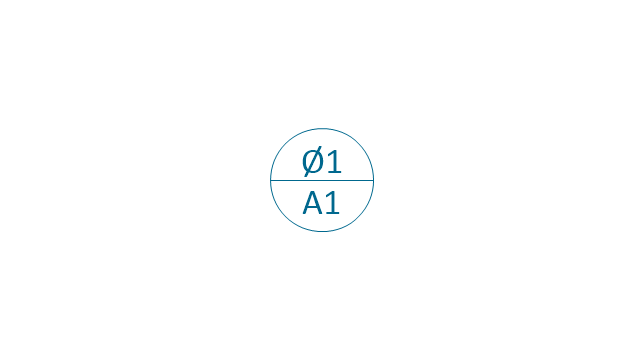
The example chart "Elements of welding symbol" is redesigned using the ConceptDraw PRO diagramming and vector drawing software from the Wikipedia file: Elements of a welding symbol.PNG.
[en.wikipedia.org/ wiki/ File:Elements_ of_ a_ welding_ symbol.PNG]
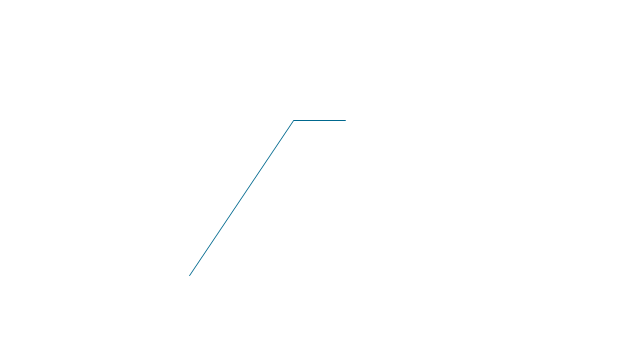
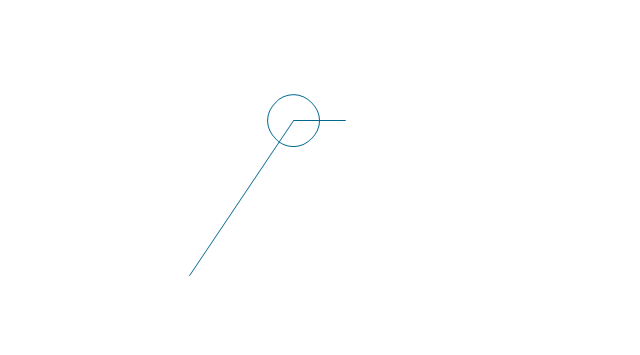
The diagram example "Elements location of a welding symbol" is contained in the Mechanical Engineering solution from the Engineering area of ConceptDraw Solution Park.
In engineering drawings, each weld is conventionally identified by an arrow which points to the joint to be welded. The arrow is annotated with letters, numbers and symbols which indicate the exact specification of the weld. In complex applications, such as those involving alloys other than mild steel, more information may be called for than can comfortably be indicated using the symbols alone. Annotations are used in these cases." [Symbols and conventions used in welding documentation. Wikipedia]
The example chart "Elements of welding symbol" is redesigned using the ConceptDraw PRO diagramming and vector drawing software from the Wikipedia file: Elements of a welding symbol.PNG.
[en.wikipedia.org/ wiki/ File:Elements_ of_ a_ welding_ symbol.PNG]
The diagram example "Elements location of a welding symbol" is contained in the Mechanical Engineering solution from the Engineering area of ConceptDraw Solution Park.
Welding joint symbol chart

 Mechanical Engineering
This solution extends ConceptDraw PRO v.9 mechanical drawing software (or later) with samples of mechanical drawing symbols, templates and libraries of design elements, for help when drafting mechanical engineering drawings, or parts, assembly, pneumatic,
HelpDesk
How to Create a Fault Tree Analysis Diagram (FTD) in ConceptDraw PRO

HelpDesk
How to Create Flowchart Using Standard Flowchart Symbols

The vector stencils library "Dimensioning and tolerancing" contains 45 symbols of geometric dimensions and mechanical tolerances, geometric symbols, callouts, and text boxes and inserts.
Use these geometric dimensioning and tolerancing (GD&T) shapes to create annotated mechanical drawings in the ConceptDraw PRO diagramming and vector drawing software extended with the Mechanical Engineering solution from the Engineering area of ConceptDraw Solution Park.
www.conceptdraw.com/ solution-park/ engineering-mechanical
Datum (old)
-dimensioning-and-tolerancing---vector-stencils-library.png--diagram-flowchart-example.png)
Box callout
Datum symbol
Callout
All around callout
Text block

2 datum frame
Simple frame

Basic frame

1 datum frame
3 datum frame
Straightness

Flatness

Line profile

Circularity

Cylindricity

Surface profile

Position
Concentricity

Symmetry
Parallelism

Perpendicularity
Angularity
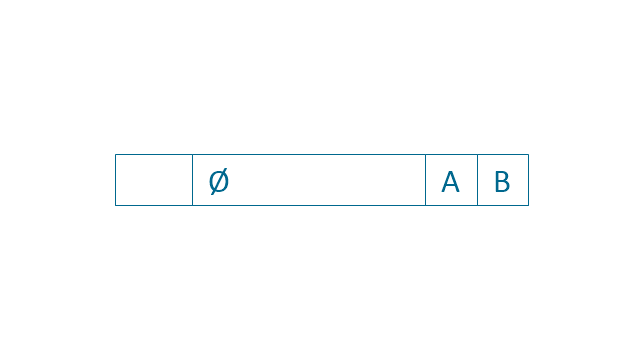
Material condition
Arc length
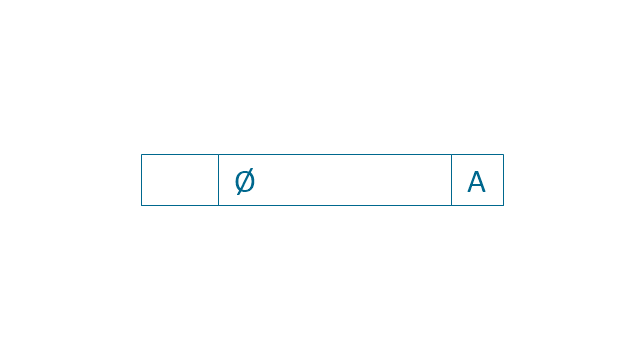
Diameter

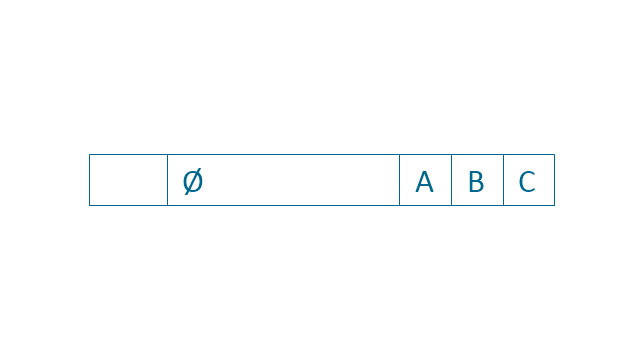
Counterbore/ spotface

Countersink

Depth
Slope
Conical taper
Statistical tolerance
Datum (new)
-dimensioning-and-tolerancing---vector-stencils-library.png--diagram-flowchart-example.png)
Datum (new) 2
-2-dimensioning-and-tolerancing---vector-stencils-library.png--diagram-flowchart-example.png)
Target point
Target line
Target area (circle)
-dimensioning-and-tolerancing---vector-stencils-library.png--diagram-flowchart-example.png)
Target area (rectangle)
-dimensioning-and-tolerancing---vector-stencils-library.png--diagram-flowchart-example.png)
Total runout
Total runout 2
Circular runout
Circular runout 2

Surface finish

Surface finish, removal process

Surface finish, no process permitted

 ConceptDraw Solution Park
ConceptDraw Solution Park collects graphic extensions, examples and learning materials
HelpDesk
Event-driven Process Chain (EPC) Diagram Software

- Basic Symbol In Mechanical Engineering
- All Basic Mechanical Engineering Symbol
- Types Of Mechanical Drawing Symbol Emphasis Machine Symbols
- Elements location of a welding symbol | Basic Nomenclature In ...
- What Is The Basic Symbol In Technical Drawing
- Mechanical Drawing Symbols | Basic Flowchart Symbols and ...
- Mechanical Drawing Symbol S
- Symbol And Explanation Of Mechanical Drawing
- Mechanical Drawing Symbols | Process Flow Diagram Symbols ...
- Mechanical Drawing Symbols | Mechanical Engineering | Basic ...
- Quality Drawing Symbol
- Process Flowchart | Elements location of a welding symbol | Basic ...
- Technical Drawing Software | Mechanical Engineering | Elements ...
- Mechanical Drawing Symbols | Mechanical Engineering | Elements ...
- Common joint types | Welded joints types | Butt weld geometry ...
- Mechanical Drawing Symbols | Elements location of a welding ...
- Elements location of a welding symbol | Building Drawing
- Mechanical Engineering | ConceptDraw Solution Park | Total Quality ...
- Mechanical Drawing Symbols | Elements location of a welding ...
- Mechanical Engineering | Technical drawing - Machine parts ...