This double bar chart sample shows the nitrate concentration in milligrams per liter in Community Water Systems (CWS), mean and maximum by year, in New Mexico in 1999-2015. It was drawn using data from the New Mexico's Indicator-Based Information System (NM-IBIS) website. [ibis.health.state.nm.us/ indicator/ complete_ profile/ CommWaterNitrates.html]
"Nitrate toxicity is a preventable cause of methemoglobinemia (blue baby syndrome), especially in infants. Infants younger than 4 months of age are at greatest risk of toxicity from nitrate-contaminated drinking water.
These infants are more susceptible to developing methemoglobinemia because the pH of their gut is normally higher (less acidic) than in older children and adults. The higher pH enhances the conversion of ingested nitrate to the more toxic nitrite. The bacterial flora of a young infant's gut is also different from that found in older children and adults and might be more likely to convert ingested nitrate to nitrite. Gastroenteritis can increase body transformation of nitrate to nitrite and absorption into the bloodstream of nitrite from the large intestine.
A large proportion of hemoglobin in young infants is in the form of fetal hemoglobin. Fetal hemoglobin is more readily oxidized to methemoglobin (MHg) by nitrites than is adult hemoglobin. In addition, in infants, the enzyme (NADH-dependent methemoglobin reductase) responsible for reduction of formed MHg back to normal hemoglobin has only about half the activity it has in adults.
Symptoms such as shortness of breath and bluish skin coloring around the mouth, hands, or feet, can occur in infants rapidly over a period of days. If the condition is severe, it could lead to convulsions, coma, and even death, if untreated. Most older children and adults can take in larger amounts of nitrate without experiencing the same health effects as infants. However, pregnant women, nursing mothers, and people with low stomach acid conditions or those deficient in an enzyme that changes MHg back to normal hemoglobin are more susceptible to nitrate-induced methemoglobinemia and could be affected by water with nitrate levels above 10 mg/ L.
Adverse reproductive outcomes such as spontaneous abortions, intrauterine growth retardation, and various birth defects such as anencephaly have been reported in scientific literature from exposure to high nitrate levels in drinking water; however, the evidence is inconsistent.
Little is known about possible health effects from high nitrate level exposure over a long period of time. However, some studies suggest that there might be a risk of stomach, esophageal or bladder cancers in people with prolonged ingestion of high levels of nitrate. This might be due to the formation of nitrosoamines in the body following ingestion exposure to high levels of nitrate.
International Agency for Research on Cancer (IARC) classified ingested nitrate or nitrite as probably carcinogenic to humans (Group 2A) under conditions that result in formation of nitroso-compounds (e.g., nitrosoamines) in the body (endogenous nitrosation)." [ibis.health.state.nm.us/ indicator/ view/ CommWaterNitrates.MeanMax.Year.html]
The column chart example "Nitrate concentration in Community Water Systems (CWS)" was created using the ConceptDraw PRO diagramming and vector drawing software extended with the Bar Graphs solution from the Graphs and Charts area of ConceptDraw Solution Park.
Double bar graph
.png--diagram-flowchart-example.png)
 Pharmacy Illustrations
Pharmacy Illustrations solution with improbable quantity of predesigned vector objects and icons of pharmacy symbols, medical and health products, pharmacy images of drugstore products, pharmacy clipart of medication tools, pharmacy logo, and other pharmacy pictures is the best for designing the pharmacy illustrations of varied kinds, pharmacy and medical diagrams and schematics, for making the presentation slides and posters on the medical, pharmacy, pharmacology and pharmaceutical thematics, for designing the illustrative materials about ways of prevention diseases and also treatment them, for creation colorful illustrations helpful in newborn and baby care, the infographics and collages to be presented at the premises of medical establishments and during the lectures at the medical education institutions, also on the billboards and in other advertising materials.
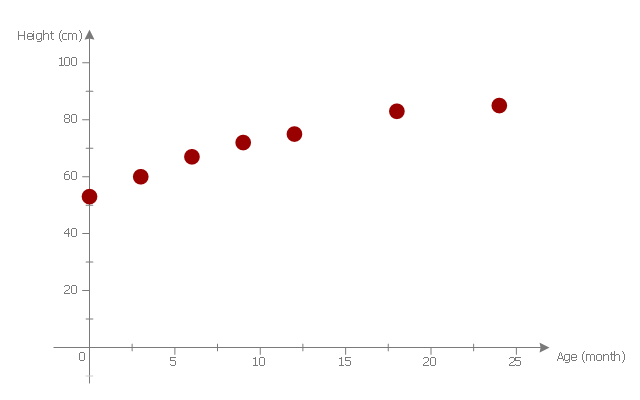
This scatter graph example visualize correlation between baby height and age.
"Human height is the distance from the bottom of the feet to the top of the head in a human body, standing erect. It is usually measured in centimetres when using the metric system, and feet and inches when using the imperial system. Human height has varied from under 60 centimetres (2 ft 0 in) to over 260 centimetres (8 ft 6 in). On average, males are taller than females. ...
Growth in stature, determined by its various factors, results from the lengthening of bones via cellular divisions chiefly regulated by somatotropin (human growth hormone (hGH)) secreted by the anterior pituitary gland. ...
The majority of linear growth occurs as growth of cartilage at the epiphysis (ends) of the long bones which gradually ossify to form hard bone. The legs compose approximately half of adult human height, and leg length is a somewhat sexually dimorphic trait. Some of this growth occurs after the growth spurt of the long bones has ceased or slowed. The majority of growth during growth spurts is of the long bones. Additionally, the variation in height between populations and across time is largely due to changes in leg length. The remainder of height consists of the cranium. Height is sexually dimorphic and statistically it is more or less normally distributed, but with heavy tails." [Human height. Wikipedia]
The scatter plot example "Baby height by age" was created using the ConceptDraw PRO diagramming and vector drawing software extended with the Scatter Diagrams solution from the Graphs and Charts area of ConceptDraw Solution Park.
Scatter diagram
 Scatter Diagrams
The Scatter Diagrams solution extends ConceptDraw DIAGRAM functionality with templates, samples, and a library of vector stencils that make construction of a Scatter Plot easy. The Scatter Chart Solution makes it easy to design attractive Scatter Diagrams used in various fields of science, work, and life activities. ConceptDraw DIAGRAM lets you enter the data to the table and construct the Scatter Plot Graph automatically according to these data.
This exploded pie chart sample shows the economic sector weightings. It was designed on the base of the Wikimedia Commons file: Badpie.png [commons.wikimedia.org/ wiki/ File:Badpie.png].
This image is available under the Creative Commons Attribution-ShareAlike 3.0 Unported License [creativecommons.org/ licenses/ by-sa/ 3.0/ ].
"The classical breakdown of all economic sectors follows:
Primary: Involves the retrieval and production of raw materials, such as corn, coal, wood and iron. (A coal miner and a fisherman would be workers in the primary sector.)
Secondary: Involves the transformation of raw or intermediate materials into goods e.g. manufacturing steel into cars, or textiles into clothing. (A builder and a dressmaker would be workers in the secondary sector.)
Tertiary: Involves the supplying of services to consumers and businesses, such as baby-sitting, cinema and banking. (A shopkeeper and an accountant would be workers in the tertiary sector.)
In the 20th century, it began to be argued that traditional tertiary services could be further distinguished from "quaternary" and quinary service sectors." [Economic sector. Wikipedia]
The exploded pie chart example "Economic sector weightings" was created using the ConceptDraw PRO diagramming and vector drawing software extended with the Pie Charts solution of the Graphs and Charts area in ConceptDraw Solution Park.
Exploded pie chart

 Scrum Workflow
The Scrum Workflow Solution extends the capabilities of ConceptDraw DIAGRAM with a large collection of professionally-designed samples and a selection of ready-to-use scrum design elements: scrum diagrams and arrows, scrum icons of people, artifacts, workflow, workspace and other colorful scrum clipart, and also scrum charts.
 Australia Map
For graphic artists creating accurate maps of Australia. The Australia Map solution - allows designers to map Australia for their needs, offers a collection of scalable graphics representing the political geography of Australia, split into distinct state
 IDEF Business Process Diagrams
Use the IDEF Business Process Diagrams solution to create effective database designs and object-oriented designs, following the integration definition methodology.
 Landscape & Garden
The Landscape and Gardens solution for ConceptDraw DIAGRAM is the ideal drawing tool when creating landscape plans. Any gardener wondering how to design a garden can find the most effective way with Landscape and Gardens solution.
 macOS User Interface
macOS User Interface solution extends the ConceptDraw DIAGRAM functionality with powerful GUI software graphic design features and tools. It provides an extensive range of multifarious macOS Sierra user interface design examples, samples and templates, and wide variety of libraries, containing a lot of pre-designed vector objects of Mac Apps icons, buttons, dialogs, menu bars, indicators, pointers, controls, toolbars, menus, and other elements for fast and simple designing high standard user interfaces of any complexity for new macOS Sierra.
- Double bar chart - Nitrate concentration in Community Water ...
- Baby height by age | Scatter Diagrams | Baby Age And Height ...
- How to Create a Bar Chart | Double bar chart - Nitrate concentration ...
- Basic Diagramming | Line Chart Examples | Line Graph | Scatter Plot ...
- Flow chart Example. Warehouse Flowchart | Basic Flowchart ...
- Scatter Diagrams | Blank Scatter Plot | Scatter Chart Examples ...
- Scatter Plot Graph | Scatter Plot | Scatter Chart Examples | Graph A ...
- Business - Workflow diagram | Production Plan Flow Chart For A ...
- Fishbone Diagram | Baby height by age | How to Create a Fishbone ...