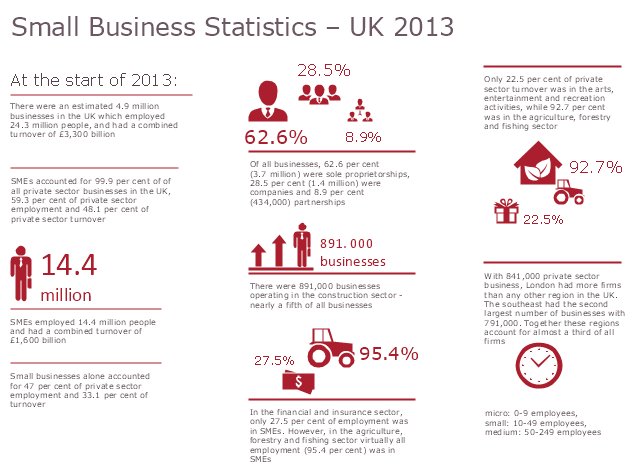
This infogram sample was created on the base of statistics data from the website of the Federation of Small Businesses (FSB), UK. [fsb.org.uk/ stats]
The infographics example "Small Business Statistics – UK 2013" was created using the ConceptDraw PRO diagramming and vector drawing software extended with the Pictorial Infographic solition from the area "What is infographics" in ConceptDraw Solution Park.
The infographics example "Small Business Statistics – UK 2013" was created using the ConceptDraw PRO diagramming and vector drawing software extended with the Pictorial Infographic solition from the area "What is infographics" in ConceptDraw Solution Park.
Pictorial infogram
 Pie Charts
Pie Charts are extensively used in statistics and business for explaining data and work results, in mass media for comparison (i.e. to visualize the percentage for the parts of one total), and in many other fields. The Pie Charts solution for ConceptDraw PRO v10 offers powerful drawing tools, varied templates, samples, and a library of vector stencils for simple construction and design of Pie Charts, Donut Chart, and Pie Graph Worksheets.
- Smart Phone Statistics Png
- Statistics Png
- Mobile - Vector stencils library | Sms Heart Vector Png
- Skier Hd Png Images
- Pie Charts | Donut Chart | Chart Templates | Donut Chart Png
- Graph Donut Png
- Pie Charts | DroidDia prime | Pie Chart Software | Circle Graph Png ...
- Powerpoint Ring Png
- Png Circle Chart Blank
- Blue Png Donut Circle
- Business - Vector stencils library | Shake Hand Png
- Good Statistic Company Clipart Png
- Business - Vector stencils library | Shake Hand Vector Png
- Exchange Money Png Vector
- Small Business Statistics – UK 2013 | Typography Font | Singapore ...
- Percentage Chart Png
- Chemistry Equation Symbols | Business - Vector stencils library ...
- Percentage Charts Png
- Doughnut Chart Png
- Vector Pie Chart Png Images