Visualizing Sales Data
Sales Dashboard Solution
ConceptDraw DIAGRAM is a powerful tool for making sales dashboards that provides performance to your sales department. The Sales Dashboard Solution gives users the ability to use live data to drive displays that show sales performance in a wide variety of graphs, meters and gauges. The Sales Dashboard Solution allows users to use sales data to benchmark performance, predict long-term trends and set goals for their sales teams. The clean and dynamic dashboard objects are driven by data files, and are updated automatically as the data changes.
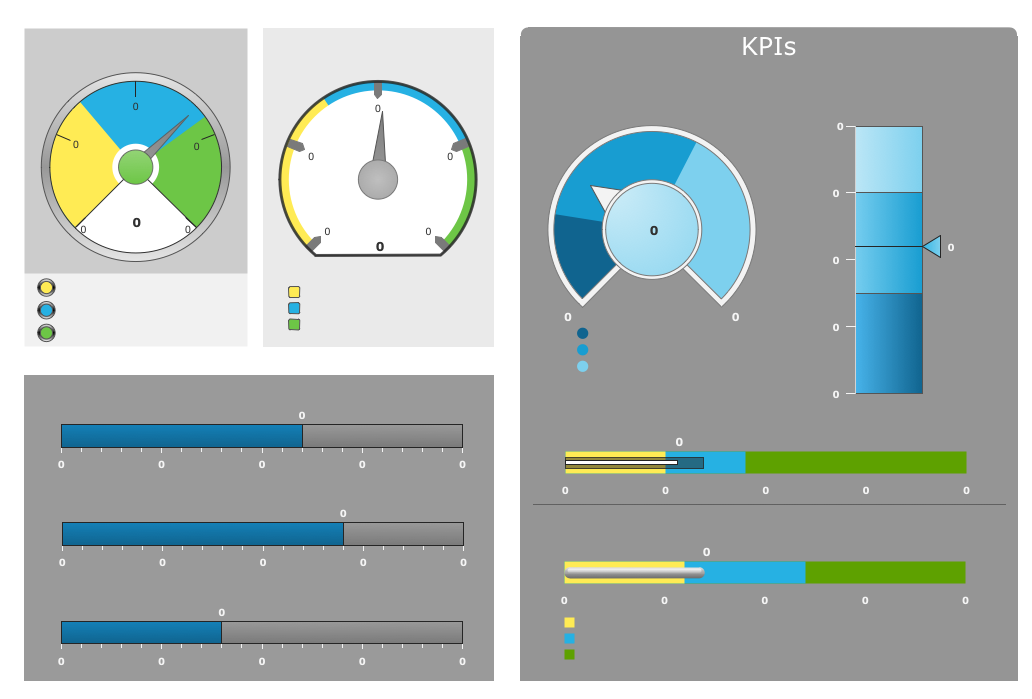
Pic. 1. Sales Dashboards
ONE RELATED HOW TO's:
Boost your brand awareness and recognition through graphic design.
ConceptDraw DIAGRAM business graphics software provides wide opportunities for creativity and helps generate amazing visuals.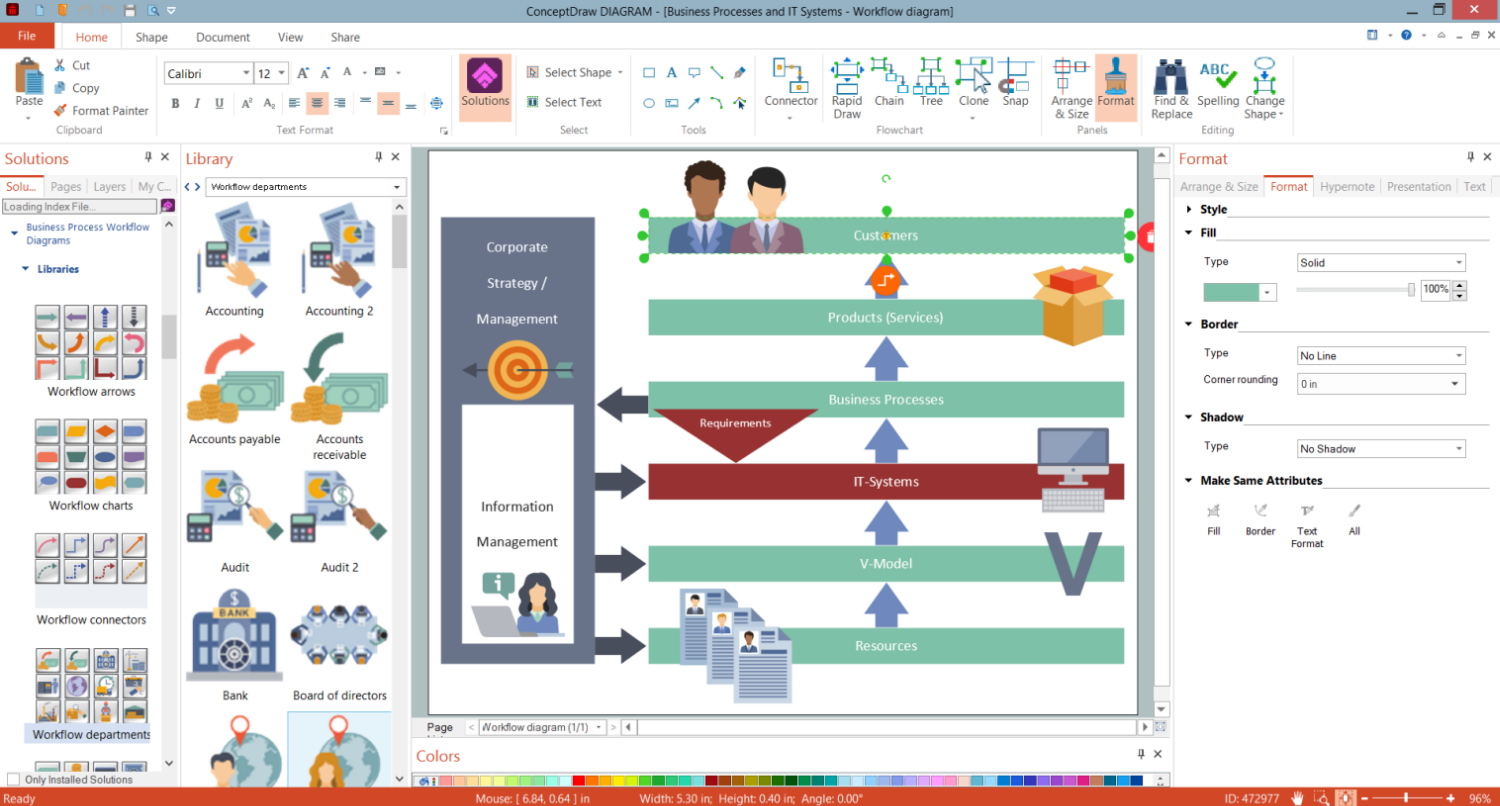
Picture: Business Graphics Software
ConceptDraw
DIAGRAM 18