Example 1. Spatial Data
Spatial Infographics Solution offers the extensive drawing tools and 9 libraries with 387 vector shapes for illustrating spatial data and drawing spatial infographics of any complexity:
- Africa Library
- Asia Library
- Australia Library
- Europe Library
- Landmarks LaLibrary
- Latin America Library
- Map Symbols Library
- North America Library
- Transport Map Library

Example 2. Spatial Infographics Solution in ConceptDraw STORE
Spatial Infographics Solution contains also collection of spatial infographic examples, samples and templates. They was created by our designer specially for you. You are able to open any desired sample or template from ConceptDraw STORE and change it for your needs. Below is represented one of templates included in Spatial Infographics Solution.

Example 3. Spatial Infographics — Location Map Template
The samples you see on this page were created in ConceptDraw DIAGRAM using the predesigned vector elements from the libraries of the Spatial Infographics Solution. An experienced user spent 5-10 minutes creating each of these samples.
Use the Spatial Infographics Solution for effective and professional presenting the spatial data and easy drawing successful Spatial Infographics.
All source documents are vector graphic documents. They are available for reviewing, modifying, or converting to a variety of formats (PDF file, MS PowerPoint, MS Visio, and many other graphic formats) from the ConceptDraw STORE. The Spatial Infographics Solution is available for all ConceptDraw DIAGRAM or later users.
THREE RELATED HOW TO's:
Explore practical flowchart examples including business process diagrams, workflow charts, swimlane flowcharts, and IT troubleshooting flows. Review common patterns and start from ready templates.
Picture: Flowchart Examples
Related Solution:
When trying to figure out the nature of the problems occurring within a project, there are many ways to develop such understanding. One of the most common ways to document processes for further improvement is to draw a process flowchart, which depicts the activities of the process arranged in sequential order — this is business process management. ConceptDraw DIAGRAM is business process mapping software with impressive range of productivity features for business process management and classic project management. This business process management software is helpful for many purposes from different payment processes, or manufacturing processes to chemical processes. Business process mapping flowcharts helps clarify the actual workflow of different people engaged in the same process. This samples were made with ConceptDraw DIAGRAM — business process mapping software for flowcharting and used as classic visio alternative because its briefly named "visio for mac" and for windows, this sort of software named the business process management tools.
This flowchart diagram shows a process flow of project management. The diagram that is presented here depicts the project life cycle that is basic for the most of project management methods. Breaking a project into phases allows to track it in the proper manner. Through separation on phases, the total workflow of a project is divided into some foreseeable components, thus making it easier to follow the project status. A project life cycle commonly includes: initiation, definition, design, development and implementation phases. Distinguished method to show parallel and interdependent processes, as well as project life cycle relationships. A flowchart diagram is often used as visual guide to project. For instance, it used by marketing project management software for visualizing stages of marketing activities or as project management workflow tools. Created with ConceptDraw DIAGRAM — business process mapping software which is flowcharting visio alternative or shortly its visio for mac, this sort of software platform often named the business process management tools.
Picture: Process Flowchart: A Step-by-Step Comprehensive Guide
Related Solution:
Do you like infographics and data visualization? Creating infographics is super-easy with ConceptDraw.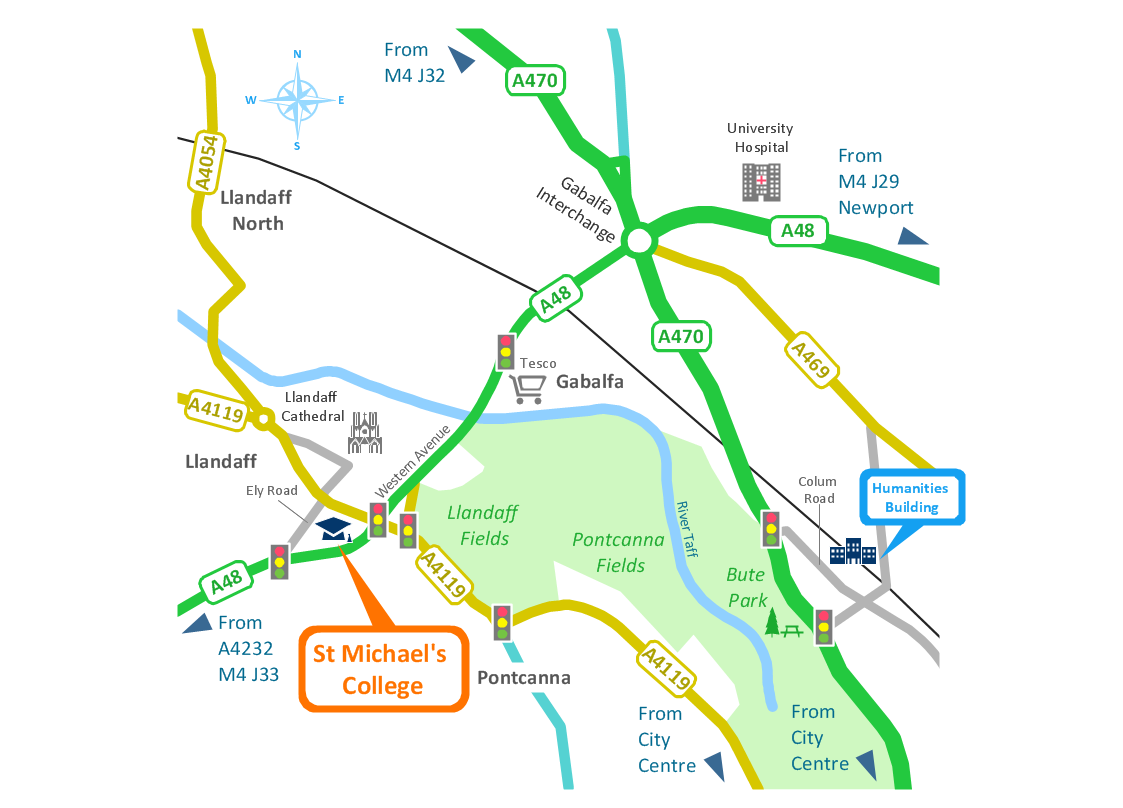
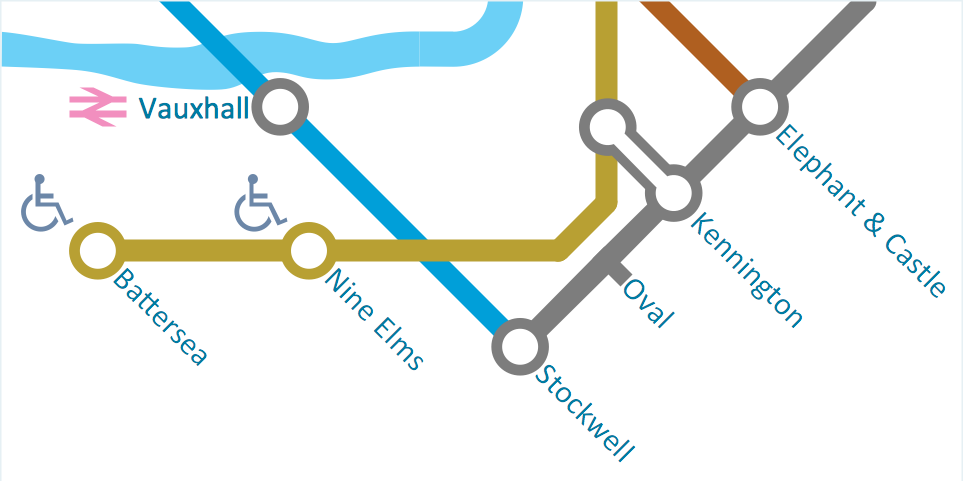
Picture: Spatial infographics Design Elements: Transport Map
