Single-line Diagram
Single-line diagram (SLD) also known as a One-line diagram is a simplest symbolic representation of a portion or entire electric power system. It shows the power distribution path from the incoming power source to each load, the arrangement of the major electrical system components and their connections in a simple view. It is the first step to the easy design and development of an electrical system. Electrical elements like transformers, capacitors, switches, circuit breakers, regulators, and many more are shown by standardized simple schematic symbols. The circuit nodes are electrically distinct and connected with the lines in the Single-line diagram. At the same time, supply and return paths (two physical conductors) are represented with a single line. Often nodes are physical busbars, which consume or supply power to the system.
Single-line Diagram is a simplified way to represent a three-phase power system. It simplifies the analysis and maintenance of the electrical distribution system within a facility and helps in the development of a critical response plan. The diagram reflects the main characteristics of the included components like the voltage, resistance, reactance, output rating, size of electrical appliances, etc. Along with a schematic, these characteristics form an overall picture of the electrical system. It is useful and necessary for all stakeholders - electricians, electrical engineers, designers, system operators. It is also important that all changes in the electrical system should be reflected in its plan to ensure adequate protection and safety of a given facility.
The Single-line diagrams are helpful for both the development and maintenance of electrical systems, troubleshooting, rerouting power after faults, and changing system configurations in order to increase their performance, reliability, and safety. All system modifications, installation of new equipment, changes in configuration, utility, source or protection devices, system impedance, or settings should be instantly reflected in a diagram. Regular updates are obligatory even for small changes.
SLD documents help to understand system behavior and indicate where the disconnecting means are located and how the alternate sources may be isolated. It is an important safety document, the main resource to determine selective protection coordination, calculate short-circuit currents and incident energy. The Single-line diagrams are significant for both building new facilities and modification or extention existing ones. Because all hasty and not plan-agreed modifications can cause hazards.

Example 1. Single-line Diagram - Diagram Differential Protection
The development of a Single-line diagram is the first step in preparing a critical response plan. Sometimes some components are omitted if they are not significant for a diagram analysis. For example, some components are significant for systems protection and insignificant for studying the load flow, and vice versa.
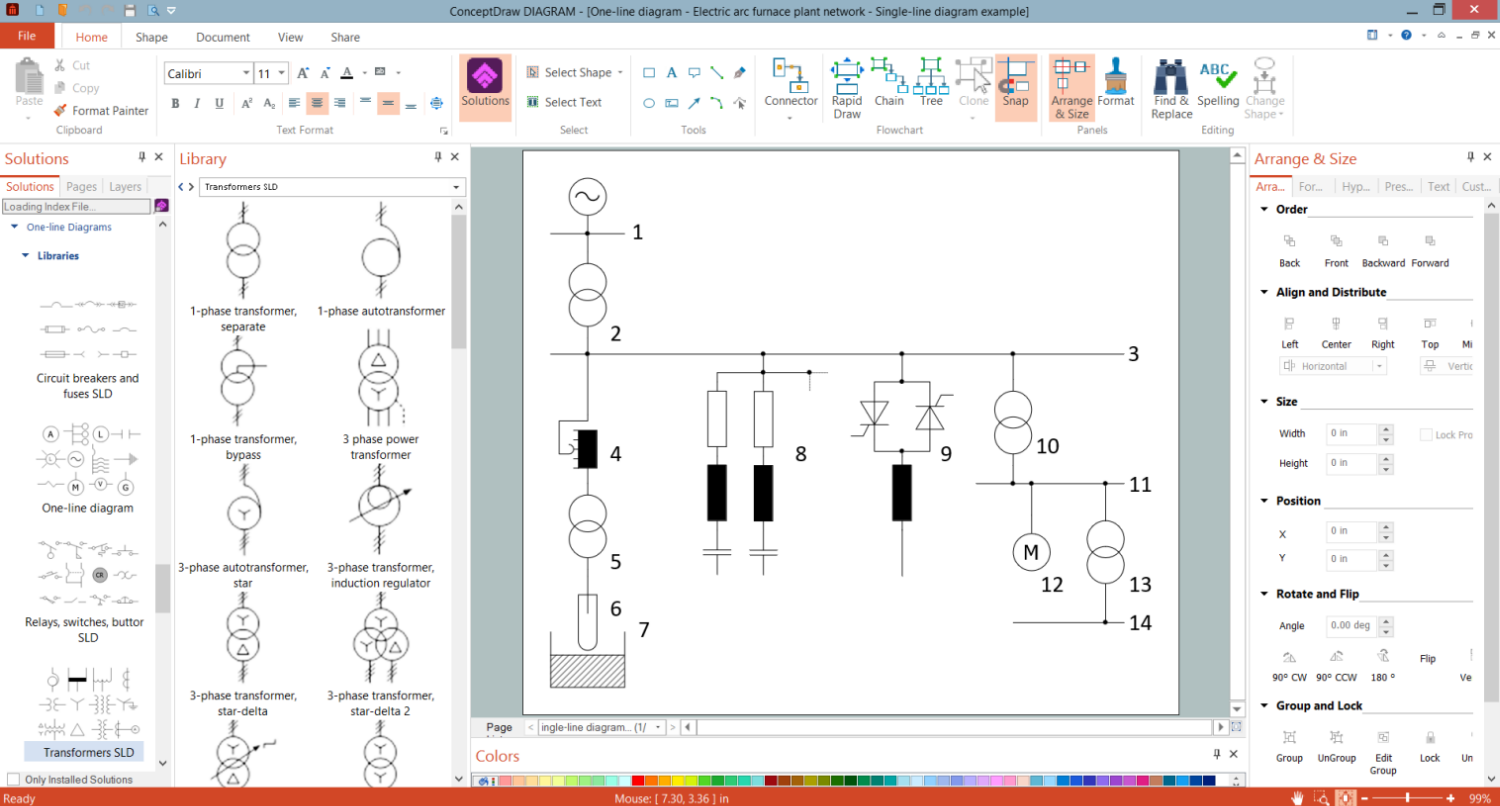
ConceptDraw DIAGRAM software and One-line Diagrams solution offer powerful tools to create Single-line diagrams of any complexity, reflect the facility’s electrical distribution system and show how incoming power is distributed to equipment in an electrical circuit. Study and evaluate effectively the short-circuit, arc flash, and electrical safety. Use the designed diagrams to develop, install and maintain the electrical system.


Example 2. Single-Line Diagram — Static VAR Compensator
The collection of predesigned vector elements included in One-line Diagrams solution simplifies the process of creating Single-line Diagrams. There are included design elements — One-Line Diagram for generators, transistors, resistors, circuit breakers, switches, transformers, and many more electrical componenets.
As a rule, Single-line diagram design starts with the placement of the incoming source of a system’s power at the top of the page. A single line is used to show multiple conductors. The power path follows downstream from one node to another and redundant power paths are visualized side-by-side. To visually group several components, a dash-dotted box is used.

Example 3. Single-Line Diagram — Bipolar HVDC
The Single-line Diagram samples you see on this page were created in ConceptDraw DIAGRAM software using the drawing tools of the One-line Diagrams Solution. These examples successfully demonstrate the solution's capabilities and the professional results you can achieve using it. An experienced user spent 5-15 minutes creating each of these samples.
Use the drawing tools of the One-line Diagrams solution to design your own Single-line diagrams and schematics quick, easy, and effective.
All source documents are vector graphic documents. They are available for reviewing, modifying, or converting to a variety of formats (PDF file, MS PowerPoint, MS Visio, and many other graphic formats) from the ConceptDraw STORE. The One-line Diagrams Solution is available for ConceptDraw DIAGRAM users.