Oil and Gas Graphics
Oil and gas industry (also known as the petroleum industry) is an industry involved in extracting crude oil and natural gas from the depths of the Earth. Oil and gas reservoirs are found across the entire world. The works on their extraction are conducted both on land and at sea.
Oil and gas industry has great importance for the economics of both producing and consuming countries. In this regard, the tracking of changes and tendencies, solving of actual issues and problems have the highest priority for both ones. The producing countries are mainly occupied by questions of developing their resources and increasing export volumes. In turn, the consuming countries strive to reduce their dependence on imported oil and gas. They stimulate the saving of these resources, encourage mining domestic resources and developing alternative energy sources.
World energy markets are continually extending, and production of oil and gas increases. The analyzing and marketing activities in the oil and gas industry have great value. It refers to the processes of promotion, search and supplying customers. The preparation of different diagrams, schematics, graphics, analytics and promotion materials is part of this activity.
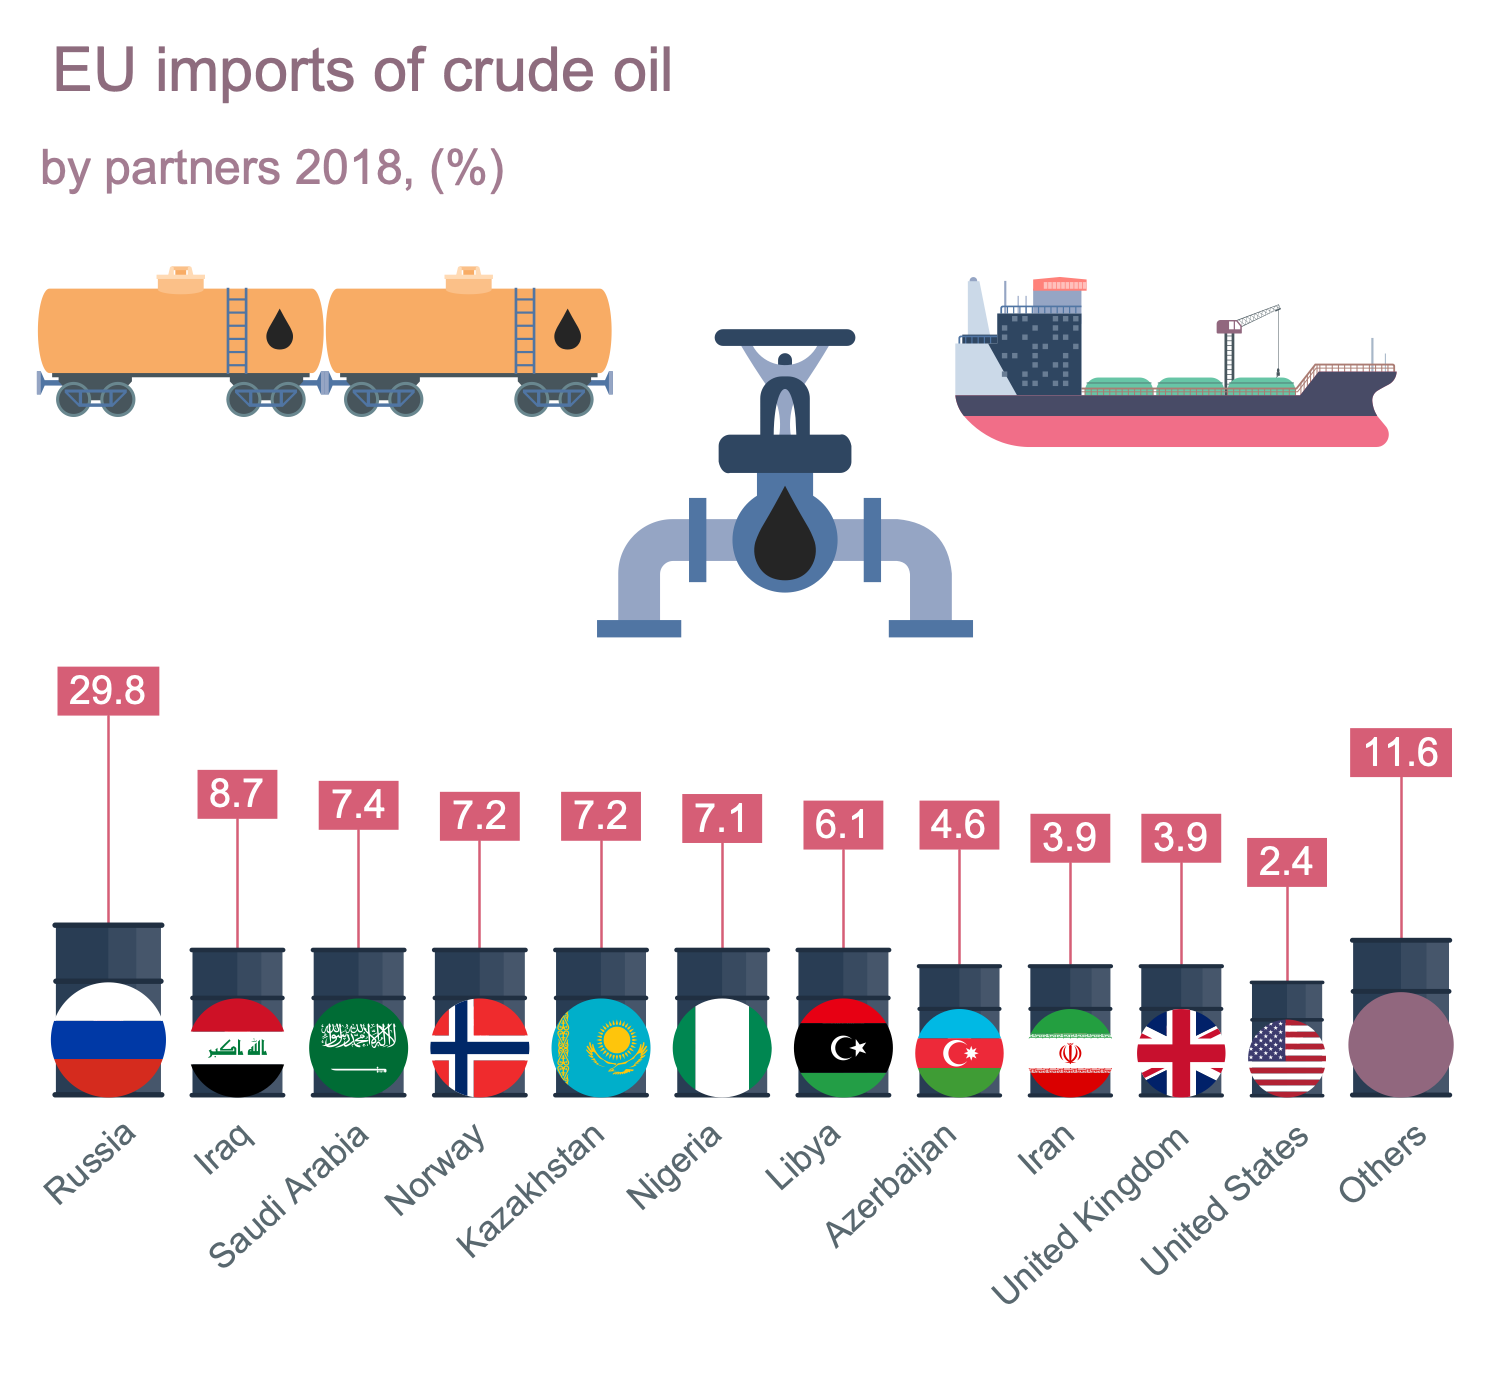
The oil and gas graphics and diagrams allow depicting the key industry indicators, marking the volumes of extracted and processed resources in specific countries and worldwide. The volumes of sold petroleum products and earned income can be also reflected. The comparison of data allows you to detect the difference in the extraction and selling volumes, evaluate if the estimated income is equal to the earned one. The comparison values for different companies allow their ranking by different factors like profit by month or year, the volume of production in barrels per day, etc.
The graphics are also useful to compare the values for different years within one company and different ones. They allow evaluating tendencies and making forecasts for the future. The oil and gas graphics help to detect the oil and gas consumption trends by countries, evaluate the global usage of petroleum and gas products, compare supply and demand. One look at a visual graphic gives you information about the periods of stability in prices and sales volumes, and ones of dramatic fluctuations. Use them to detect affecting factors and provide corrective actions in time.

Example 1. Oil and Gas Graphics
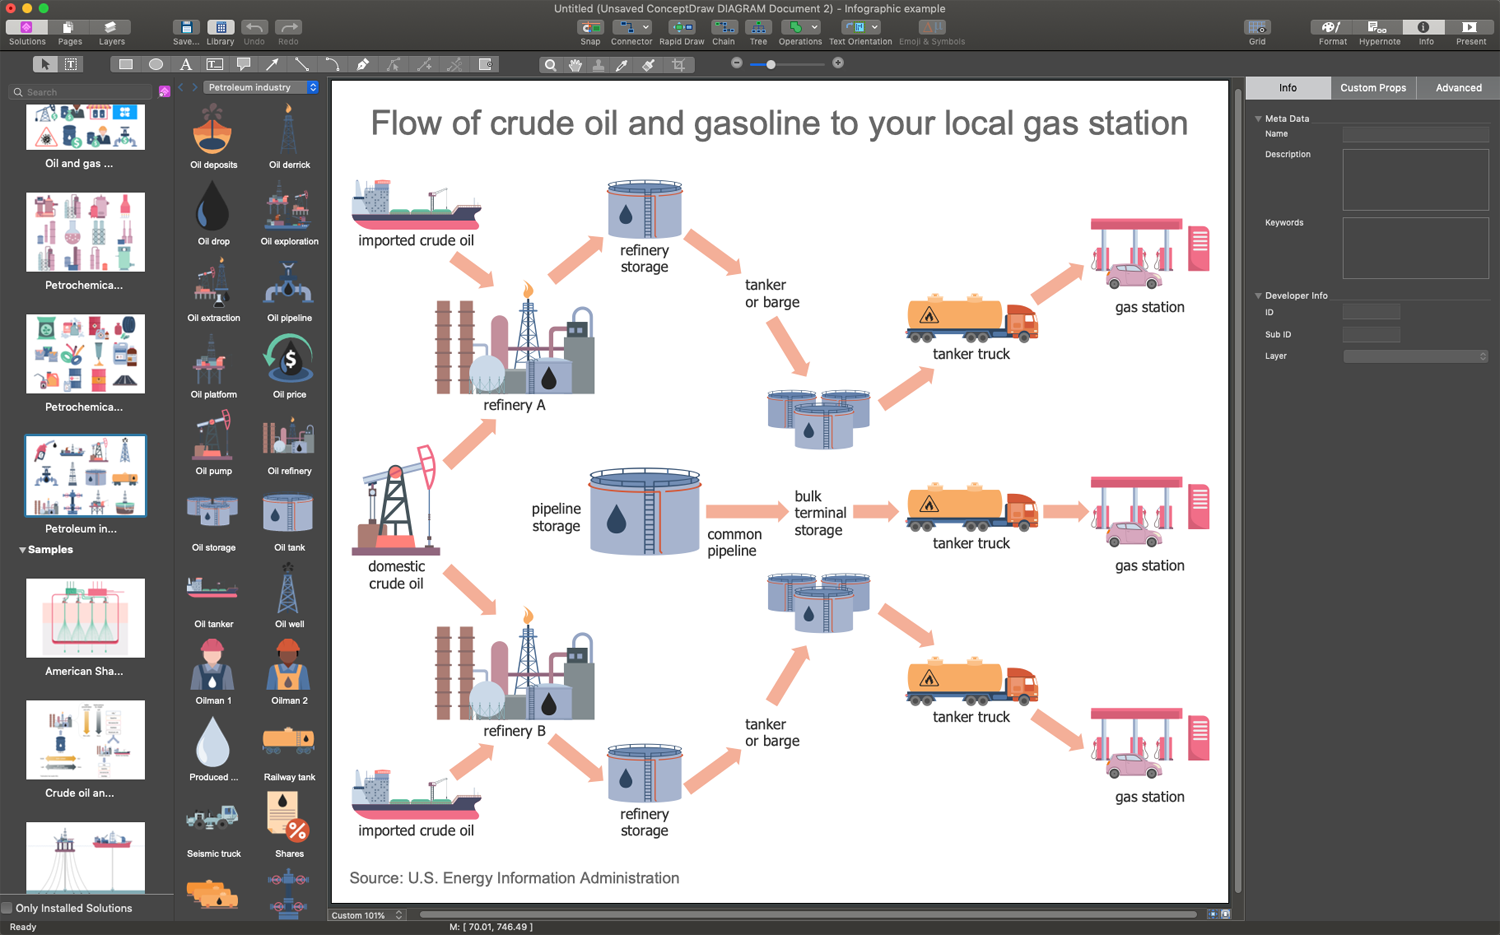
Design oil and gas graphics, illustrations, diagrams and infographics in record time and without any training in easy-to-use ConceptDraw DIAGRAM software. All tools you need are offered by Oil and Gas solution. Using it you can draw more efficiently and faster than by pencil on paper. Because the pre-made design elements — petroleum industry, gas industry, wells, refineries, petrochemical products, warning symbols and marketing clipart are included in quantity to the solution libraries. You need only drag required objects to your document and arrange in a desirable way.
Example 2. Oil and Gas Graphics Design in ConceptDraw DIAGRAM
The samples you see on this page are oil and gas graphics. They were created in ConceptDraw DIAGRAM software using the Oil and Gas Solution for ConceptDraw Solution Park. An experienced user spent 5-10 minutes creating each of these samples.
Use the Organizational Charts Solution for ConceptDraw DIAGRAM software to develop your own professional-looking diagrams related to the oil and gas industry quickly, simply, and effectively.
The possibility of exporting to a variety of popular graphical formats (PNG, JPEG, JPG, GIF, TIF, TIFF, BMP, DIB, EMF, SVG) and file formats like Microsoft PowerPoint (PPT), Adobe Acrobat (PDF), Microsoft Visio (VDX, VSDX), Adobe Flash (SWF), Encapsulated PostScript (EPS), HTML, opens wide opportunities for you.
