Oil and Gas
Oil is a naturally occurring flammable liquid discovered in rock formations. It had been formed from the carbon-riched remains of ancient plankton and seaweeds under the exposure of heat for dozens of millions of years. As results, it consists of the complex mixtures of hydrocarbons and extra organic compounds.
The crude oil gathering, processing, and transportation is a complex process. It begins with searching petroleum reserves and exploration new oil fields. It includes activities on collecting geological, geochemical, and geophysical material. Then starts the drilling of an exploratory well and evaluation of the reservoir's potential. The next phase is production. It includes extraction of hydrocarbons, processing, and refining. The impurities are removed from the oil, byproducts and petroleum products are separated. The treated oil is then transported to processing facilities for further processing and storage. The transportation of crude oil is carried by pipelines of large diameter. The shipping by tanker ships, trucks, and rail is also applied. The refined materials are sold to end-users and other industries.
Gasoline is the most, globally-used product of crude oil. Other widely-known fuel products are diesel, jet oil, heating oil, marine fuel oil. Oil is also used in pharmaceutics, medicine and cosmetics industries, in the production of lubricants, waxes, synthetic rubber, pesticides, plastics, asphalt, etc.
Natural gas is one more important natural resource. It is a compound of gases had formed in the bowels of the Earth as a result of the anaerobic decomposition of organic substances. Natural gas is a mixture of hydrocarbons, mainly methane with admixtures of other gases.
Initially the natural gas was obtained as a by-product of oil-producing because many hydrocarbon deposits contain both oil and gas. Later it began to be mined also in isolated natural gas fields, from challenging resource types: sour gas, tight gas, shale gas, and coalbed methane. Being minded in any way, natural gas is purified of non-hydrocarbons, carbon dioxide, nitrogen, helium, ethane, propane, butane, pentane, water, etc. It is then transported via pipelines or liquefied and exported as a liquefied natural gas (LNG) by carrier ships, barges, railway tanks. Natural gas is transported only in a liquefied or compressed state. It can be also conversed into other liquid products (gasoline, diesel, jet fuel) via gas to liquids technologies (GTL). Regarding the high pressure of the natural gas, its storing is realized underground in depleted gas reservoirs, salt caverns, aquifers.
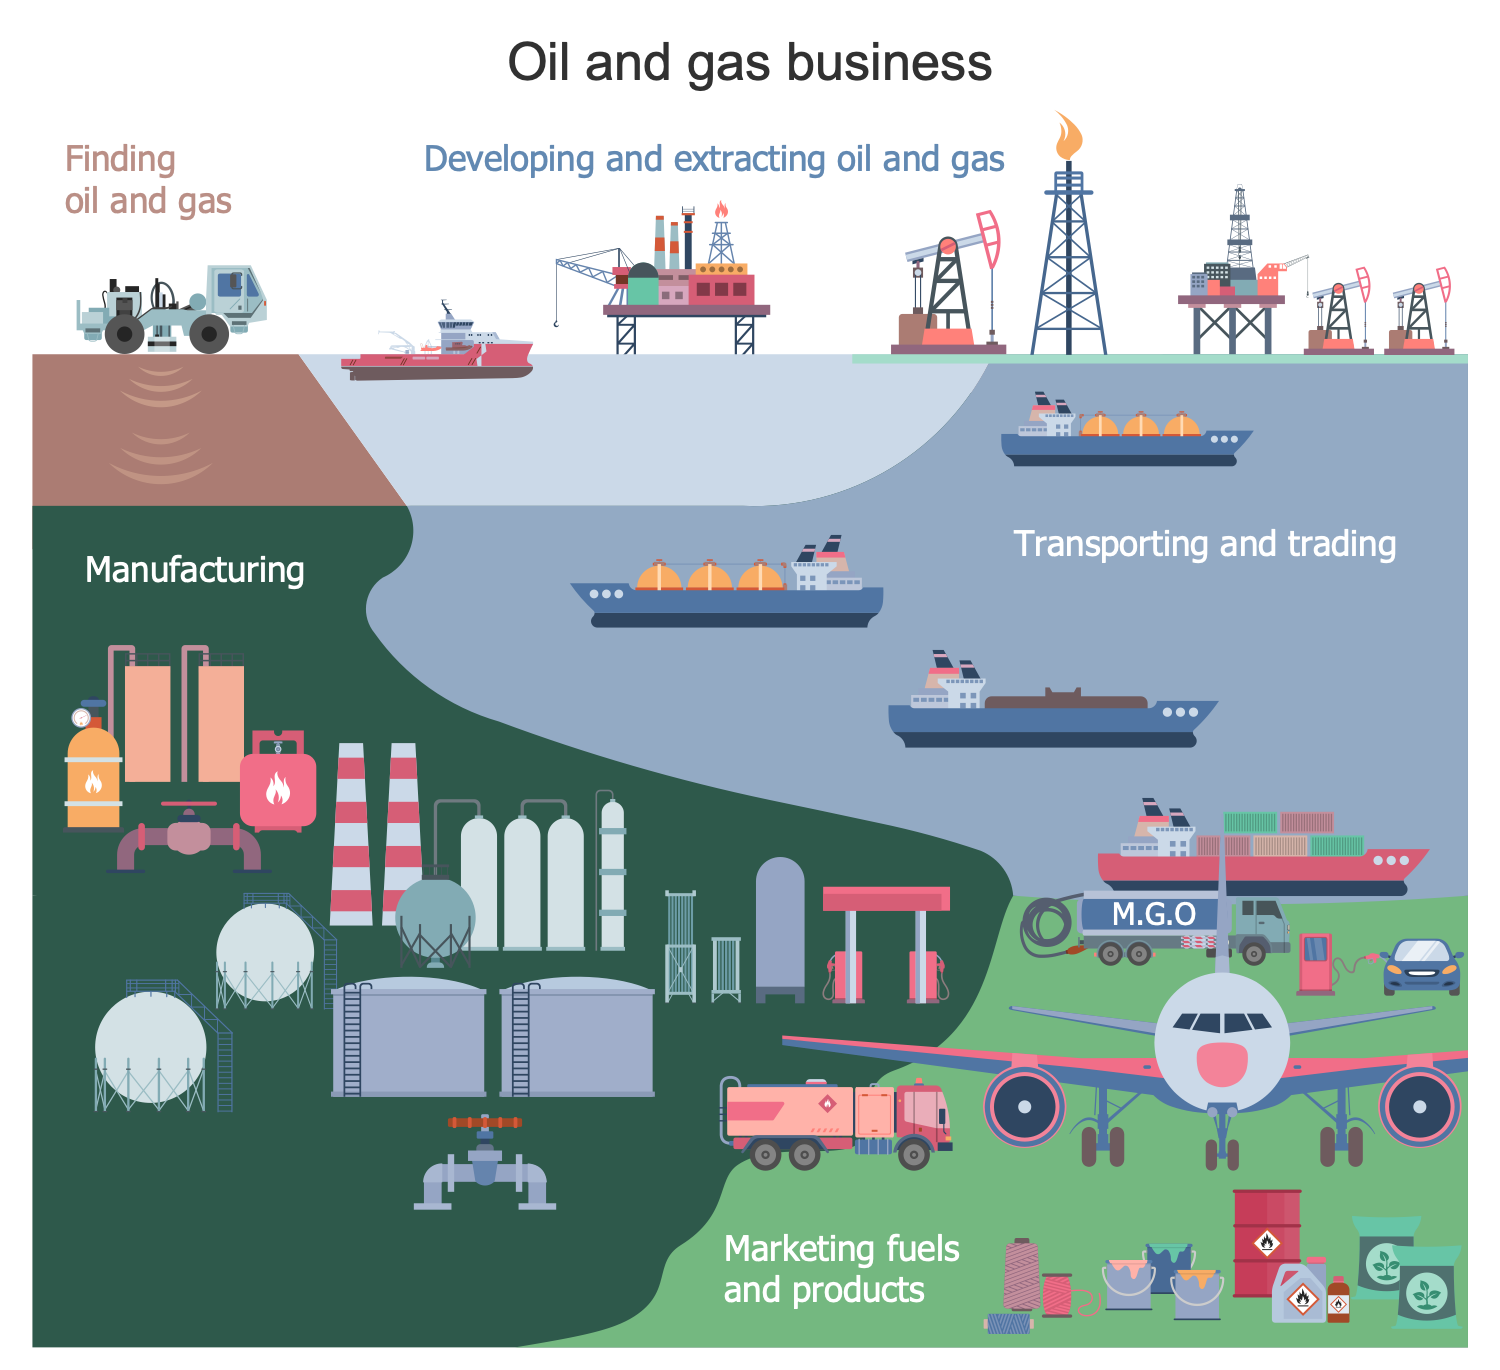
Example 1. Oil and Gas
The oil and gas industry often requires designing diagrams and illustrations of different kinds. Today, you have a perfect possibility to don’t waste valuable time and effort on drawing your illustrations and infographics when doing oil and gas business or analyzing this industry. ConceptDraw DIAGRAM including Oil and Gas solution offers a large collection of predesigned vector design objects specific to the oil and gas industry. They allow drawing precise oil and gas infographics and diagrams literally in minutes.

Example 2. Oil and Gas Wells
The samples you see on this page were created in ConceptDraw DIAGRAM software using the Oil and Gas Solution for ConceptDraw Solution Park. An experienced user spent 10-20 minutes creating each of these samples.
Use the Organizational Charts Solution for ConceptDraw DIAGRAM software to develop your own professional-looking diagrams related to the oil and gas industry quickly, simply, and effectively.
The possibility of exporting to a variety of popular graphical formats (PNG, JPEG, JPG, GIF, TIF, TIFF, BMP, DIB, EMF, SVG) and file formats like Microsoft PowerPoint (PPT), Adobe Acrobat (PDF), Microsoft Visio (VDX, VSDX), Adobe Flash (SWF), Encapsulated PostScript (EPS), HTML, opens wide opportunities for you.
TEN RELATED HOW TO's:
Accounting is a cornerstone of any business, it’s basement. If you want to have a visual representation of your finance management, use audit flowchart symbols to document the money flow. Although some would say that accounting is boring, it is very a responsible duty.
The audit flowchart symbols is supplied with ConceptDraw Audit Flowcharts solution as a vector objects library. Together with Conceptdraw Drawing capabilities it forms the helpful tool for audit process planning and setting the steps of audit by designing audit flow charts. Audit Flow charts are used to organize fiscal information tracking process as well as in accounting, finance and investment management.
Picture: Audit Flowchart Symbols
Related Solution:
Data structure diagram (DSD) is intended for description of conceptual models of data (concepts and connections between them) in the graphic format for more obviousness. Data structure diagram includes entities description, connections between them and obligatory conditions and requirements which connect them. Create Data structure diagram with ConceptDraw DIAGRAM.
Picture: Data structure diagram with ConceptDraw DIAGRAM
Diagramming is an astonishing way to visualize business processes. The list of the most common business process flowchart symbols is quite long starting from basic flowcharts, continuing with SIPOC diagrams. Business process modeling was never easier than now, with special ConceptDraw Business Process Mapping solution.
To carry out all professional standard requirements for business processes mapping, it is necessarily to follow the special graphical notations. ConceptDraw Business Process Mapping solution offers an exhaustive suite of tools to aid business process mapping. There are three vector libraries SIPOC Diagrams, Business Process Flowcharts, and Swim Lanes that contains totally more than 50 symbols of standard BPM notations. This is all that professionals need to effectively evaluate and manage quality in business processes.
Picture: Business Process Flowchart Symbols
Related Solution:
If you need to describe some process, diagramming is a perfect tool for almost any imaginable purpose. The set of the most commonly used flow charts symbols is quite wide and includes symbols for operations, processes, data inputs and outputs. You can see the full list of all the symbols used for flowcharting in Flowcharts solution from Diagrams area in ConceptDraw Solution Park.
A flow chart is often used for visual representation of a sequential process flow. The flowchart approach to any process is to divide it into some sequential actions. What makes a flow chart so popular and clear to make out is the set of standard flowchart symbols that has the same reading independently from processes described with their applying. The current drawing represents the vector library containing the pack of standard flowchart symbols. This library is supplied with ConceptDraw Flowcharts solution.
Picture: Flow Chart Symbols
Related Solution:
A flowchart is a simple but very functional tool when it comes to understanding a workflow or to removing unnecessary stages from a process. When drawing flowcharts, keep in mind that there are four common types of flowcharts, like document flowcharts and data flowcharts that show control over a data or document flow over a system. To show controls on a physical level, use system flowcharts. In addition, to show controls in a program, you can draw a program flowchart.
This flowchart diagram represents the piece of an article editing process, that involves the author and editor. It was created using the Basic Flowchart notation that consists from the basic flowchart symbols. The start and the end of the process are indicated with "Terminator" symbols. The "Process" symbols show the action steps consisting from making edits and searching for a compromise, when the author does not agree with the suggestions of the editor. The "Process" symbol is the general symbol in process flowcharts. The "Decision" symbol indicates a branching in the process flow. There are two branches indicated by a Decision shape in the current flowchart (Yes/No, Disagree/Agree). This basic flowchart can be used as a repeating unit in the workflow diagram describing the working process of some editorial office.
Picture: Types of Flowcharts
Related Solution:
Use ConceptDraw DIAGRAM diagramming and business graphics software to draw your own flowcharts of computer algorithms.
Picture: Process Flow app for macOS
Related Solution:
The ConceptDraw Flowchart component includes a set of samples and templates. This geathered as flowchart maker toolbox which focused on drawing flowcharts of any industry standards.
Picture: Flowchart Components
Related Solution:
Data flow diagrams are the graphical tool, used in the visualization of data flow of some data processing systems. It is the valuable process modeling tool. Also designing DFD is the important component of the initial part of any information system development project. The standard symbols are used to represent the interaction of a system components and how various kinds of components influence on data flow. The ConceptDraw Data Flow Diagrams solution is design to assist professional software engineers in making DFDs according to Gane and Sarson, and Yourdon and Coad notations.
Do you imagine yourself as a successful IT specialist? To your mind, they all use data flow diagram examples to learn and to get inspired. Aren’t you still with us?
Picture: Data Flow Diagram Examples
Related Solution:
ConceptDraw DIAGRAM is a world-class diagramming platform that lets you display, communicate, and present dynamically. It′s powerful enough to draw everything from basic flowcharts to complex engineering schematics.
Video tutorials on ConceptDraw products. Try it today!
Picture: Business Process Mapping — How to Map a Work Process
Related Solutions:
Event-Driven Process Chain Diagrams for improvement throughout an organisation.
ConceptDraw DIAGRAM - software that reduces the time needed to create a business process model.
Picture: Graphical Symbols to use in EPC diagrams
Related Solution:
