Medical Mycology
Medical mycology is a branch of microbiology that studies pathogenic fungal infections in humans and animals. It is a significant field of medicine because fungi are a major threat to human health and cause a wide range of various diseases. These include dermal infections, diseases of organs and systems of organs, allergies, asthma, meningitis. Fungal infections affect and are the most dangerous for severely immunocompromised people, the elderly, HIV patients, people with disruptions of protective bacterial microflora, suffered trauma or other infections. The situation is complicated by the fact that fungal infections are even more immunosuppressed.
Fungi are widely distributed in the environment. They are resistant and can multiply in both acidic and alkaline environments. Some fungi are found as a part of the normal flora of the organism, of the gastrointestinal tract, mouth, skin, genitourinary tract. However, with a reduce in immunity, they may cause mucosal infections, skin infections, allergies, and even mortality. Fungal infections may affect a complex set of disease states. Global mortality owing to fungal infections is greater than for other diseases.
The most pathogenic fungi are:
- Cryptococcus neoformans
- Aspergillus fumigatus
- Aspergillus flavus
- Candida albicans
- Candida auris
Most common fungal diseases in humans include:
- Candidiasis
- Athlete’s Foot
- Jock Itch
- Ringworm
- Yeast Infection
- Onychomycosis
- Valley Fever
- Histoplasmosis
- Blastomycosis
- Pneumocystis pneumonia
In this way, the research in medical mycology and fungal immunology are really important. Mycology helped to understand fungal biodiversity, its classification, evolution, pathogenesis, genetics, physiology, functions, and role in ecology. It allowed using of some fungi types in industrial needs like pharmaceutical production of antibiotics, the food industry. The latest improvements in medical equipment and diagnostic platforms allow identifying of infecting fungi more quickly and with better accuracy and precision.
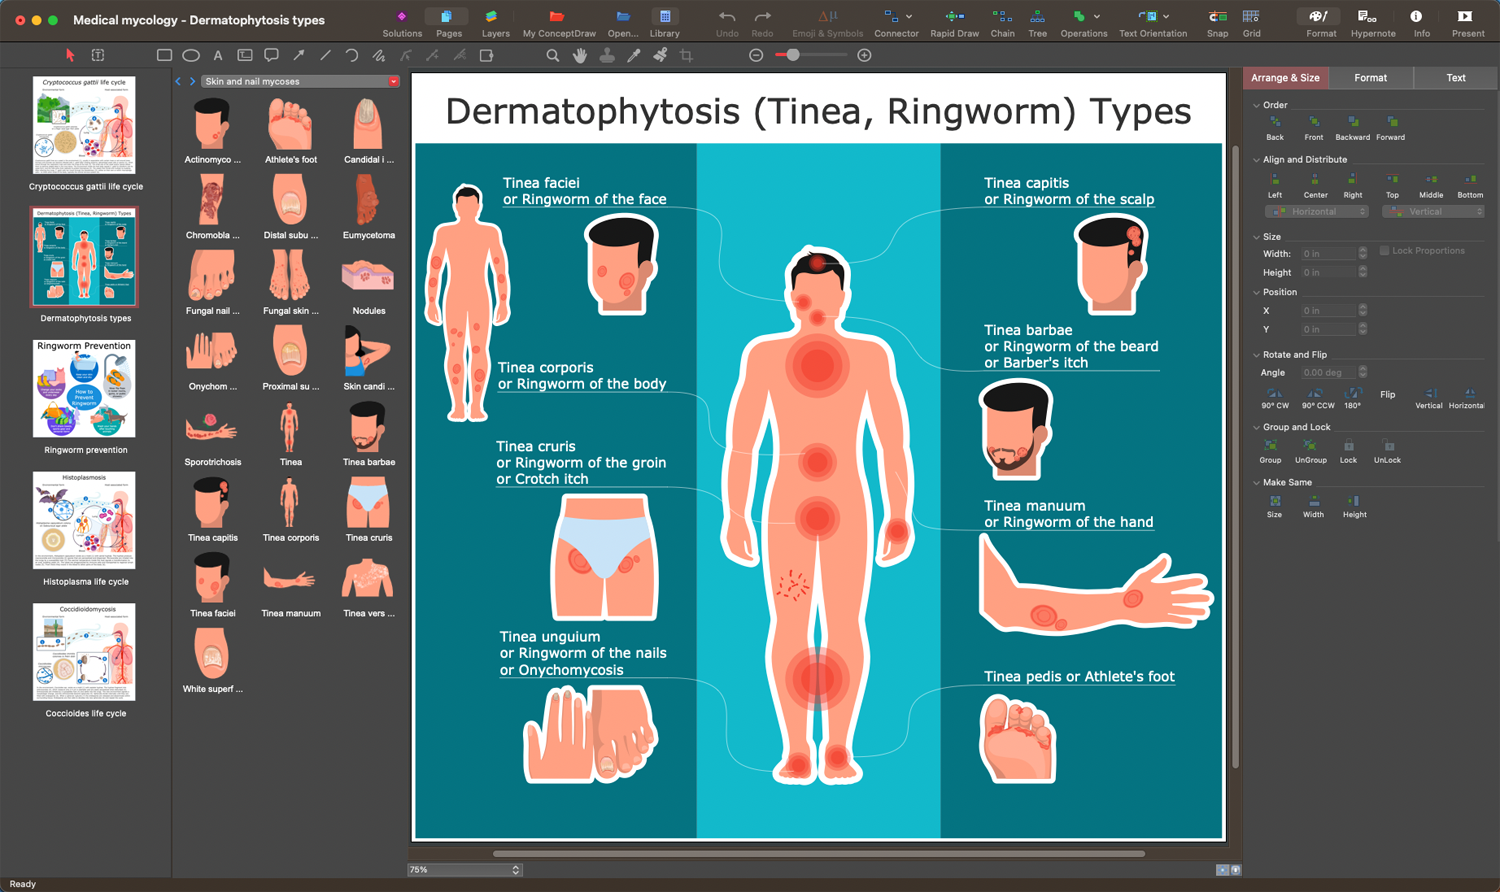
Example 1. Medical Mycology Infographics in ConceptDraw DIAGRAM
Mycology research increase success in diagnostics and analysis of fungal infections in clinical laboratories, examination of protective immunity mechanisms and immunological risks, enzymes produced and secreted by the fungi, genes and proteins, synthesis pathways, and metabolites. They help to control mycotoxin contaminations, antifungal drugs development, ways of immunotherapy, treatment, and prevention of life-threatening fungal infections, ringworm prevention, candidas and cryptococcus prevention, and more other fungi types. At the same time, medical mycology should be dynamic because new pathogenic fungi are identified regularly. In addition, the reduction of drug resistance of some fungi types complicates treatment. In the last decades, antimycotic resistance has significantly increased for many reasons.

Example 2. Medical Mycology Infographic - Histoplasma Life Cycle
The Medical Mycology solution for ConceptDraw DIAGRAM software is developed specially for fast and easy designing medical mycology infographics, diagrams and illustrations. It includes 17 libraries with a huge collection of pre-made vector design elements:
- Fungi Microscopy
- Fungal Diseases
- Fungi Biology
- Fungi Culture
- Antifungal
- Cleaning and Disinfecting
- Eye Mycoses
- Fungal Meningitis
- Fungi Hosts
- Mold
- Mycoses Diagnosis
- Mycoses Epidemiology
- Mycoses Prevention
- Mycoses Symptoms
- Mycoses Transmission
- Personal Hygiene
- Skin and Nail Mycoses

Example 3. Medical Mycology Libraries Design Elements
Use these objects to describe a variety of fungal pathogens and mycotoxins, diseases they cause in people and animals, the results of the latest research in medical mycology, microbiology, and treatment of fungal diseases. Make the overview of typical symptoms of most common fungal diseases, ways to prevent infection, methods to diagnose and treat mycosis, ways of immunotherapy and complex antifungal therapy, problem of antifungal resistance. The included samples and examples are also a perfect base for your own illustrations.

Example 4. Medical Mycology Infographic - Pneumocystis Life Cycle
The mycology infographics you see on this page were created in ConceptDraw DIAGRAM software using the Medical Mycology Solution. They successfully demonstrate the solution's capabilities and the professional results you can achieve. An experienced user spent 10-15 minutes creating each of these samples.
Use the powerful tools of the Medical Mycology Solution for ConceptDraw DIAGRAM software to create your own infographics and diagrams of any complexity fast and easy, and then successfully use them in your work activity.
All source documents are vector graphic documents. They are available for reviewing, modifying, or converting to a variety of formats (PDF file, MS PowerPoint, MS Visio, and many more graphic formats) from the ConceptDraw STORE. The Medical Mycology Solution is available for all ConceptDraw DIAGRAM users.
TEN RELATED HOW TO's:
When trying to figure out the nature of the problems occurring within a project, there are many ways to develop such understanding. One of the most common ways to document processes for further improvement is to draw a process flowchart, which depicts the activities of the process arranged in sequential order — this is business process management. ConceptDraw DIAGRAM is business process mapping software with impressive range of productivity features for business process management and classic project management. This business process management software is helpful for many purposes from different payment processes, or manufacturing processes to chemical processes. Business process mapping flowcharts helps clarify the actual workflow of different people engaged in the same process. This samples were made with ConceptDraw DIAGRAM — business process mapping software for flowcharting and used as classic visio alternative because its briefly named "visio for mac" and for windows, this sort of software named the business process management tools.
This flowchart diagram shows a process flow of project management. The diagram that is presented here depicts the project life cycle that is basic for the most of project management methods. Breaking a project into phases allows to track it in the proper manner. Through separation on phases, the total workflow of a project is divided into some foreseeable components, thus making it easier to follow the project status. A project life cycle commonly includes: initiation, definition, design, development and implementation phases. Distinguished method to show parallel and interdependent processes, as well as project life cycle relationships. A flowchart diagram is often used as visual guide to project. For instance, it used by marketing project management software for visualizing stages of marketing activities or as project management workflow tools. Created with ConceptDraw DIAGRAM — business process mapping software which is flowcharting visio alternative or shortly its visio for mac, this sort of software platform often named the business process management tools.
Picture: Process Flowchart: A Step-by-Step Comprehensive Guide
Related Solution:
ConceptDraw DIAGRAM is the best flowchart software that suits the following key factors: ✔️ ease of use, ✔️ functions, ✔️ easy-to-use tools, ✔️ pre-made elements and templates, ✔️ customization, ✔️ collaboration, ✔️ compatibility, ✔️ support, ✔️ updates, ✔️ cost
Picture: Flowchart Software: A Step-by-Step Guide
Related Solution:
A database is a data collection, structured into some conceptual model. Two most common approaches of developing data models are UML diagrams and ER-model diagrams. There are several notations of entity-relationship diagram symbols and their meaning is slightly different. Crow’s Foot notation is quite descriptive and easy to understand, meanwhile, the Chen notation is great for conceptual modeling.
An entity relationship diagrams look very simple to a flowcharts. The main difference is the symbols provided by specific ERD notations. There are several models applied in entity-relationship diagrams: conceptual, logical and physical. Creating an entity relationship diagram requires using a specific notation. There are five main components of common ERD notations: Entities, Actions, Attributes, Cardinality and Connections. The two of notations most widely used for creating ERD are Chen notation and Crow foot notation. By the way, the Crow foot notation originates from the Chen notation - it is an adapted version of the Chen notation.
Picture: ERD Symbols and Meanings
Related Solution:
ConceptDraw DIAGRAM - workflow software extended with the Workflow Diagram solution provides a complete set of samples, templates and features help you to draw diagrams faster. A workflow software you use for drawing workflow diagrams and business process flow diagrams should provide a wide set of examples allows you get closer with workflow diagrams, learn symbols meaning, find appropriate layout and design, and then start drawing your own workflow diagram masterfully. Workflow diagrams used for orchestrating organizational processes between company departments and humans, so critical process diagrams used to train many people to interact must be clear and professional to convey an idea from a view. Thats a reason we created a lot workflow symbols and workflow icons collected them into special Workflow Diagram solution in ConceptDraw Solution Park.
Picture: Workflow Diagram Examples
Related Solution:
If you are just a beginner in drawing flowcharts, it may seem that a sheet of paper and a pen are just enough. However, at the time you would want to share your results, diagramming applications would suite you better. it’s very easy to create diagrams that way and to discover new kinds of flowcharts.
The huge collection of sample ConceptDraw diagrams, charts, illustrations and other types of business drawings includes a wide range of business themes. A huge number of graphic images of ConceptDraw documents is divides on business application areas according to business-oriented solutions for which they were made.Here is a short visual list of samples of flowcharts, process diagrams, UML models, management charts, computer network diagrams, maps, infographics, illustrations, etc. In short, each ConceptDraw solution is accompanied with at least ten samples representing some particular examples of the application of the given chart.
Picture: Applications
When thinking about data visualization, one of the first tools that comes to mind is a flowchart design. You can find flowchart symbols, shapes, stencils and icons easily on the Internet, but it might take time to systematize this information. Nevertheless, once you start flowcharting, you’ll love its simplicity and efficiency.
This diagram consists from standard flowchart symbols, approved by ANSI (American National Standard Institute) for drawing flowcharts. A flowchart is a diagram that represents a step-by-step algorithm of any process, displaying the process stages as boxes that are connected with arrows. Flowchart design makes it clear and readable.
Flowchart designed using ConceptDraw DIAGRAM flowchart software allows to make attractive and clear process presentation, it makes interpretation of the business process flow fresh and versatile. Great flowchart design view is a big advantage over the diagram created manually on a paper.
Picture:
Flowchart Design
Flowchart Symbols, Shapes, Stencils and Icons
Related Solution:
It can be tough to get straight into business papers and processes.Otherwise, you can learn how to create flowcharts for an accounting information system and visualize these documents. Accounting diagrams are clear and easy to understand for all the participants of the process.
There are symbols used for creating accounting flowcharts using ConceptDraw DIAGRAM and its Accounting Flowcharts solution. Accounting flow charts are a special kind of flow charts. Actually a variety of flowcharts are often used to facilitate many aspects of a workflow of accounting department. Accounting flowcharts are utilized to support creating accounting documentation, to depict positions responsible for fulfillment of each phase of accounting workflow.
Picture:
How to Create Flowcharts for an
Accounting Information System
Related Solution:
A flowchart is a powerful tool for examining processes. It helps improving processes a lot, as it becomes much easier to communicate between involved people, to identify potential problems and to optimize workflow. There are flowcharts of different shapes, sizes and types of flowchart vary from quite basic process flowcharts to complex program flowcharts. Nevertheless, all these diagrams use the same set of special symbols like arrows to connect blocks, parallelogram to show data receiving or rectangles for showing process steps.
Basic flowcharts are used to represent a simple process algorithm. A basic flowchart notation consists of rectangles (business processes), arrows (the flow of information, documents, etc.). The same notation is used in items such as the "decision", which allow you to do the branching. To indicate the start of the entire business process and its termination can be used the "Terminator" element. The advantages of Basic Flowchart are simplicity and clarity. With it you can quickly describe the business process steps. Creating of Basic Flowchart does not require any special knowledge, as easily understand by employees with different levels of education and IQ.
Picture: Types of Flowchart: Comprehensive Overview
Related Solution:
There are many ways to track the system in a critical situation. To model a system behavior, uml notation is widely used. Usually, an UML diagram consists of elements such as actor and a case.
This diagram represents the structure of UML notations. Unified Modeling Language (UML) is used in software engineering to depict graphically the software modeling process. UM Language uses graphic notations for developing models of object-oriented systems. These notations displays requirements, sub-systems, logical and physical elements, etc. We created this diagram using ConceptDraw DIAGRAM reinforced with Rapid UML solution. It can be helpful for students on software engineering, when learning UML.
Picture: UML Notation
Related Solution:
Local area network connects computers and other network appliances within an area, such as office building or a campus. It can be difficult to provide such network without a predesigned plan. For these purposes you can use network diagram software, which helps you to create LAN network diagrams and office network diagrams quickly and effortless. This will speed up your work and you can save the diagram for the future network improvements.
The following diagram illustrates a network topology of the small office. LAN configuration has a star topology. The local network joins 8 computers among which are several desktop PCs, laptop, two iMacs and iBook. The end-point devices are divided into three groups. Each group is connected to its hub. There is a network printer and a modem, which are interconnected with other devices through a network server. Each computer on the LAN can access the server through a corresponding hub.
Picture: Network Diagram Software. LAN Network Diagrams. Physical Office Network Diagrams
Related Solution: