Infographics Free Software
An infographic is a visual representation of any kind of information or data and a valuable tool for visual communication. Currently, infographics have become of particular importance and power in the context of actively increasing digitalization. The infographic combines information and graphics, which complement each other to create a more complete picture. It is easy to read and allows covering and presenting large volumes of information in compact, compressed, and understandable form making accents at the key points.
Infographics include images, clipart, charts, statistic graphs, and other kinds of visual graphics. They grab a reader’s attention efficiently, help to share data or research findings and compare them visually. The last research confirms that people comprehend and remember information better and faster when the content is combined with relevant visuals. Infographics are used both in the Internet, on websites and social media, and outside it in print materials including brochures, posters, billboards, etc. Infographics are a way to present information or send a message in a captivating and creative form, easy to perceive and remember.
Infographics have a lot of benefits and many applications. They have exploded in popularity in virtually every industry in the last decades. Currently, they are an important tool in business, statistics, education, marketing, consulting, nonprofits, government, etc. Infographics are used by businesses to promote brands, goods, and services on websites, social media, printed materials, flyers, brochures, making offerings, etc. They are used in reports to show results of work and progress, presentations, reviews with key points and results of surveys, webinars, etc.
Infographics are a great asset to marketing campaigns and to show business strategy, a way to develop and improve a brand's content strategy. It is a key tool for marketers to make an overview of a new product or service, show business achievements and prospects, improve the interest of the target audience, boost visibility, brand awareness, and engagement, drive interest on social media, and enhance website traffic. There are popular economic infographics, consulting infographics, statistical infographics, timeline infographics, geographic infographics, comparison infographics, process infographics, informational infographics, hierarchical infographics, and other types.
Infographics help educators and trainers to make content more memorable for students, create appealing educational materials that explain difficult concepts efficiently, break down complex information to easier its understanding. The latest research proves that perception and learning the information is in many times efficient when it is presented in the form of an infographic. Infographics are used in the medical sector to show healthcare information. The governmental sector uses them to share statistics, voting data, census data, law information, hierarchy of laws, etc.
Visualization with the help of creative and appealing infographics is efficient in capturing attention, improving retention, and engaging the target audience. It helps to convey complex information in an easy, accessible, and engaging way to easier understanding and help remember content more quickly and efficiently. In addition, the time to find key information decreases due to its presentation in the visual and simple form of an infographic. The use of visual elements and highlighting key points enhance the attention span, improve perception and remembering.
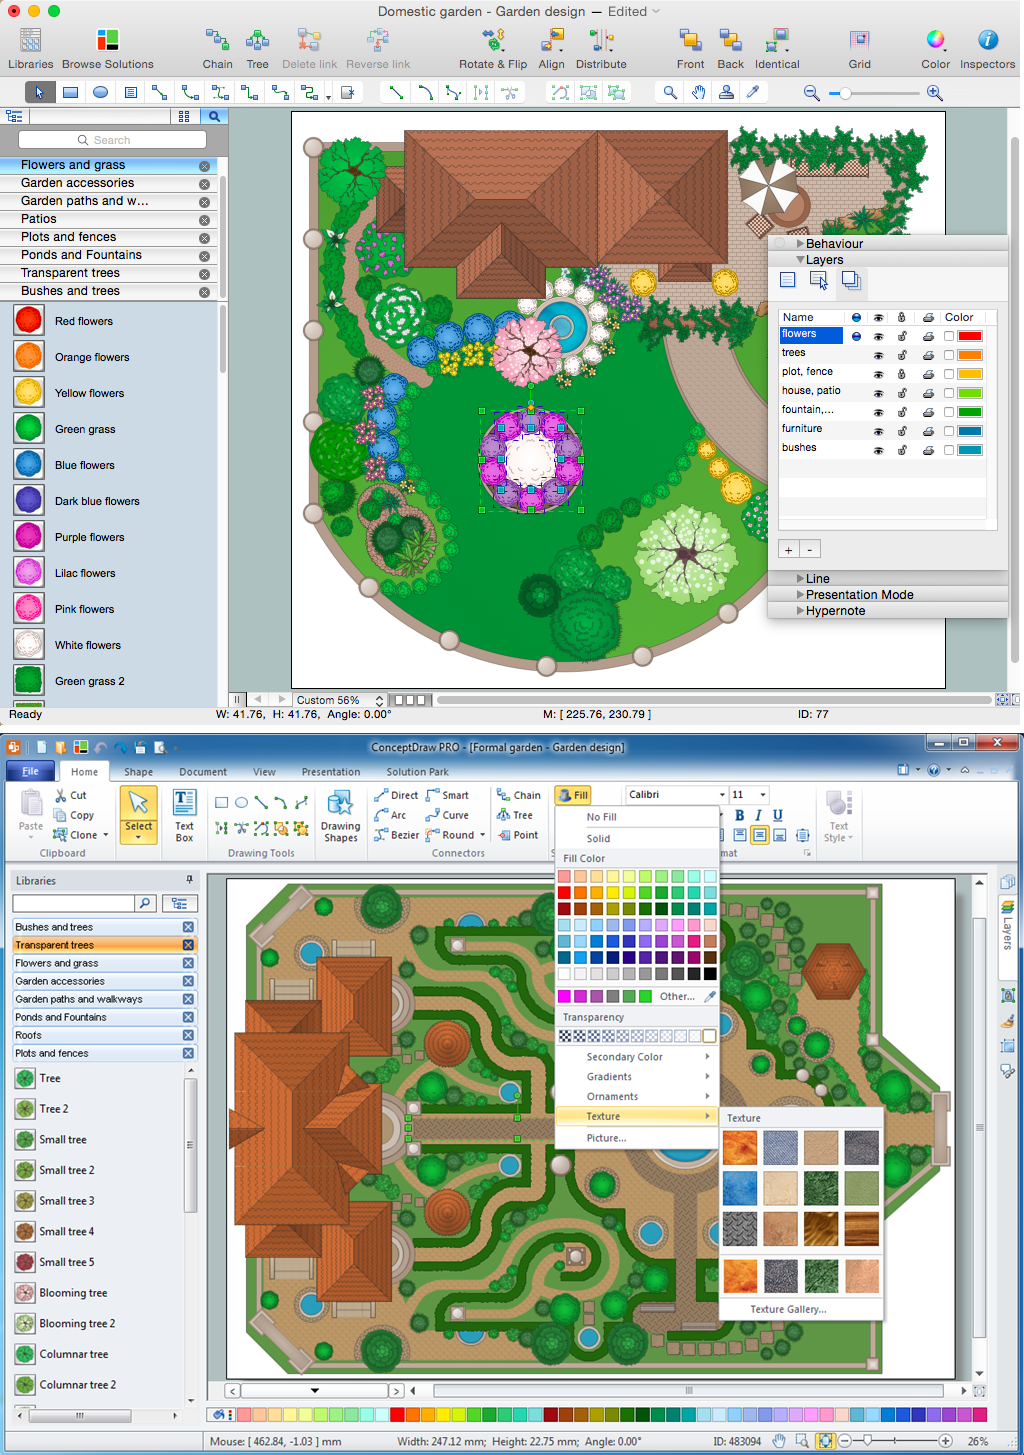
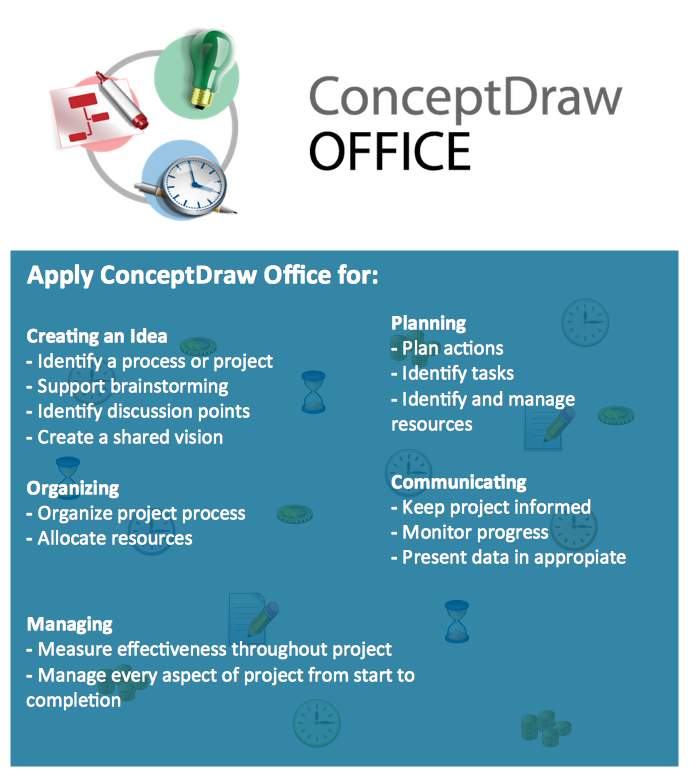
Example 1. Infographics Free Software Tools - Typography Infographic
Organize your information efficiently in an infographic with the help of powerful ConceptDraw DIAGRAM software and a set of free infographic solutions Typography Infographics, Pictorial Infographics, Data-driven Infographics, Spatial Infographics, and others. Use this infographics free software to communicate complex information in an eye-catching and engaging way.
Provide a quick overview of any topic in a visual way, summarize information and data, make complex information easy to digest, explain complex processes, compare and contrast multiple options, display research findings, survey data, and other information. Reach new audiences and increase brand awareness, help your audience to absorb the information faster. Plan a campaign strategy, provide supply chain analysis, show the annual results in reports visually, highlight successes and crisis points. Design in a few minutes by customizing any infographic template you desire from the included in ConceptDraw DIAGRAM solutions.
Use the predesigned vector elements from the solutions libraries to design without effort and save time designing professionally looking infographics. Visual elements like graphs and charts help to simplify and summarize complex information, facilitate comparison and identification of patterns, trends, and differences, increase engagement and attention, and make it easier to understand and memorize for the audience. Sometimes, visual elements even transcend language barriers and supply the universal understanding of diagrams. Combine text and visuals and make your diagrams visually appealing, stylish, and logically constructed to reach a broader audience and achieve success.

Example 2. Spatial Infographic - The 100th Tour De France
When organizing your content, primarily determine the key takeaways, titles, headers, sub-headers. Arrange text information and then supply your infographic with images, clipart, and other design elements. All details like colors, fonts, sizes, margins, and style are important. Use the property of colors to attract attention when designing your infographic. Bright colors make your infographic attractive and appealing for the audience, allow highlighting of important points, and give an overview of the topic at the cursory review.
Colorful content is accepted and remembered significantly better and quickly than in black and white. Colors have a positive impact on engagement, attract and enhance the audience, boost the reader’s attention span and remembrance of information. Do not limit yourself by simply informing your audience, make the viewing experience engaging for everyone to achieve great success. Once your infographic is ready, you can export it in different formats and easily share it with your audience, use it for web design, illustration, visualization, advertising design, print publications, and more.

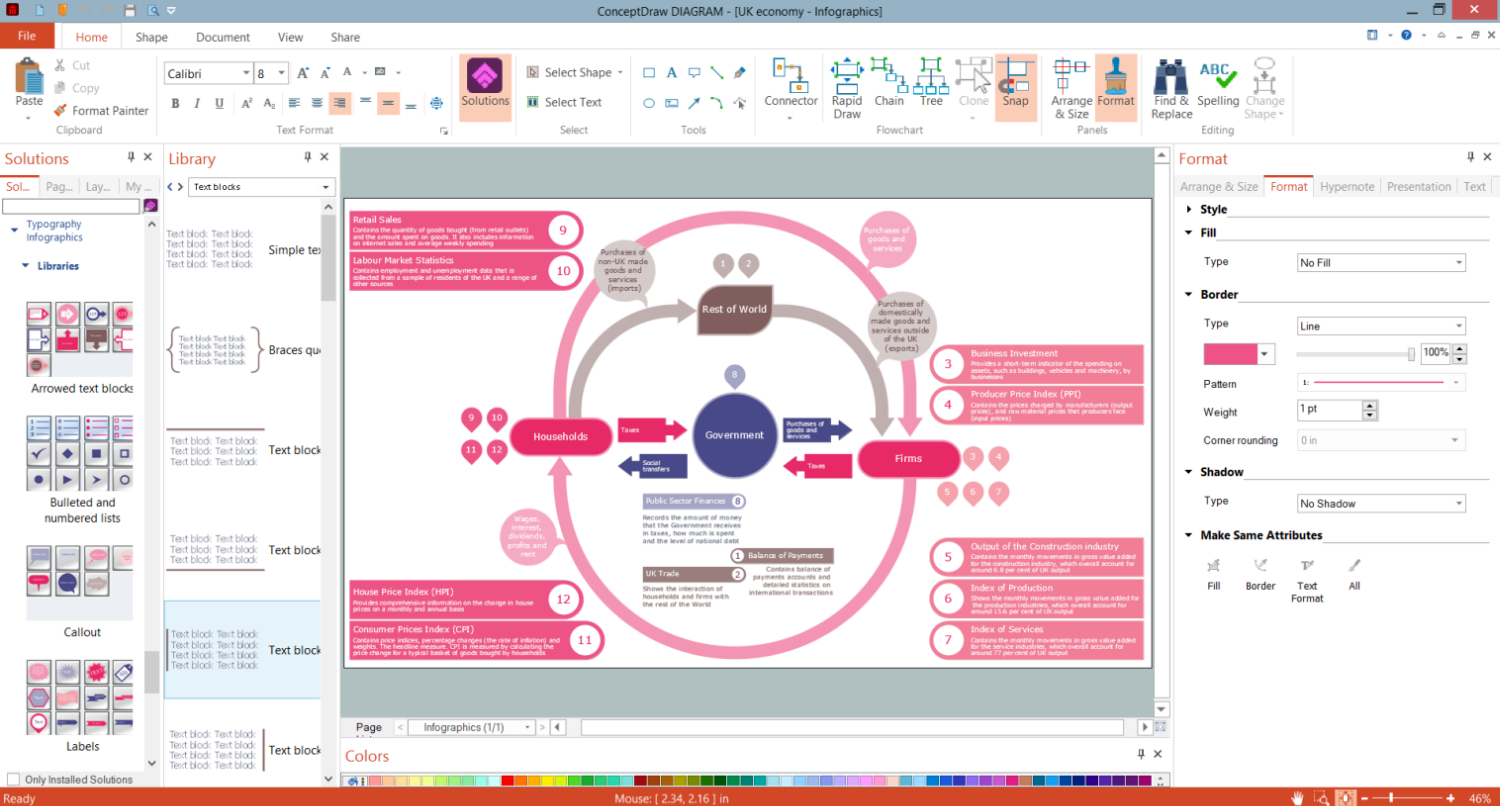
Example 3. Data-driven Infographic — Inheritances in GB
The samples you see on this page were created in DIAGRAM using the Business Process Workflow Diagrams Solution for ConceptDraw DIAGRAM They successfully demonstrate solution's capabilities and professional results you can achieve using it. An experienced user spent 10 minutes creating each of these samples.
Use the Business Process Workflow Diagrams Solution for ConceptDraw DIAGRAM software to create your own professional looking Business Process Flow Diagram quick, easy and effective, and then successfully use it in your work activity.
All source documents are vector graphic documents. They are available for reviewing, modifying, or converting to a variety of formats (PDF file, MS PowerPoint, MS Visio, and many other graphic formats) from the ConceptDraw STORE. The Business Process Workflow Diagrams Solution is available for all ConceptDraw DIAGRAM or later users.