Genealogy
Genealogy (from two Greek words meaning “race” or “family” and “theory” or “science") is the study of families, origins, and history of a particular family, tracing of kinship and lineage, the past and present family members. It is accepted to depict the family genealogy in a form of a genealogy tree or pedigree chart. Typically, the data for a tree is taken from the stories, memoirs, interviews, letters, notes in written sources, genetic analysis, and other records.
The list of ancestors is composed based on the detected data and then arranged in a tree. The family members are connected with each other by the lines in accordance with the origin, from the ancestors to the newest generations. The family tree may also include additional biographical information or medical data for the family members. These data allow tracing genetics and hereditary diseases.
There are many reasons for creating the family trees. The most common are learning about own origins and ancestors, preserving the history of own family and heritage, prolonging family traditions. In some cases, these are scientific, medical, forensic purposes, or a desire to trace the place for own family in a general historical picture.
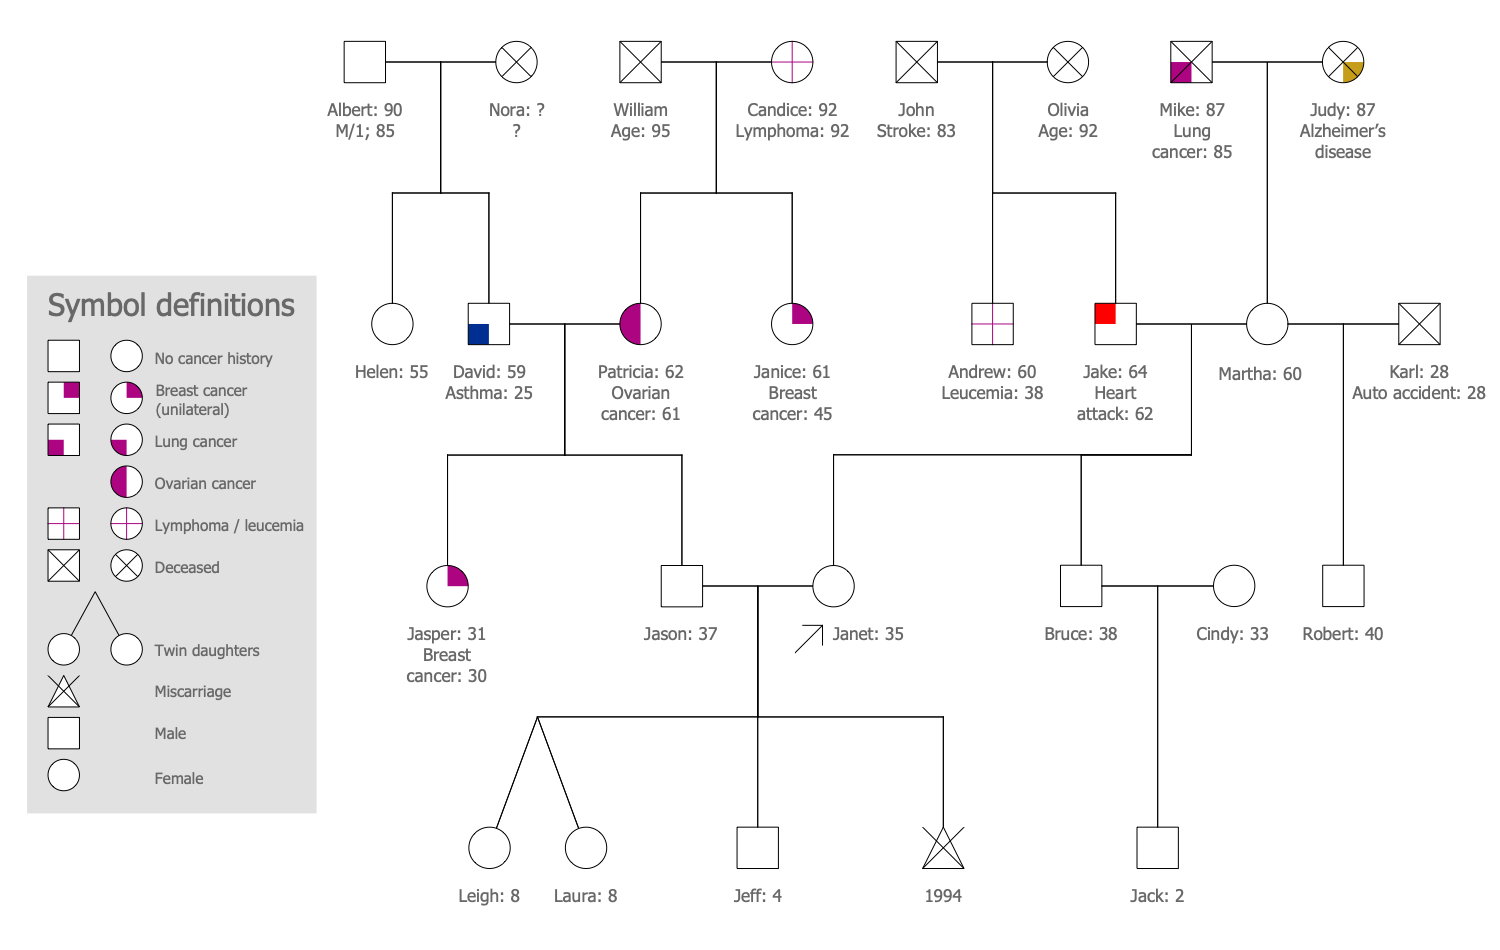
The Genograms are created with simple symbols representing the genders and the lines connecting them to illustrate family relationships. A square symbol is provided for male and a circle for female family members. There are also envisaged the special symbols illustrating twins, pregnancy, stillbirths, and many other states. The medical symbols to depict diseases including heritage ones can be found here as well. There are included the special kinds of relationships lines and symbols reflecting personal relationships between family members and emotional states.
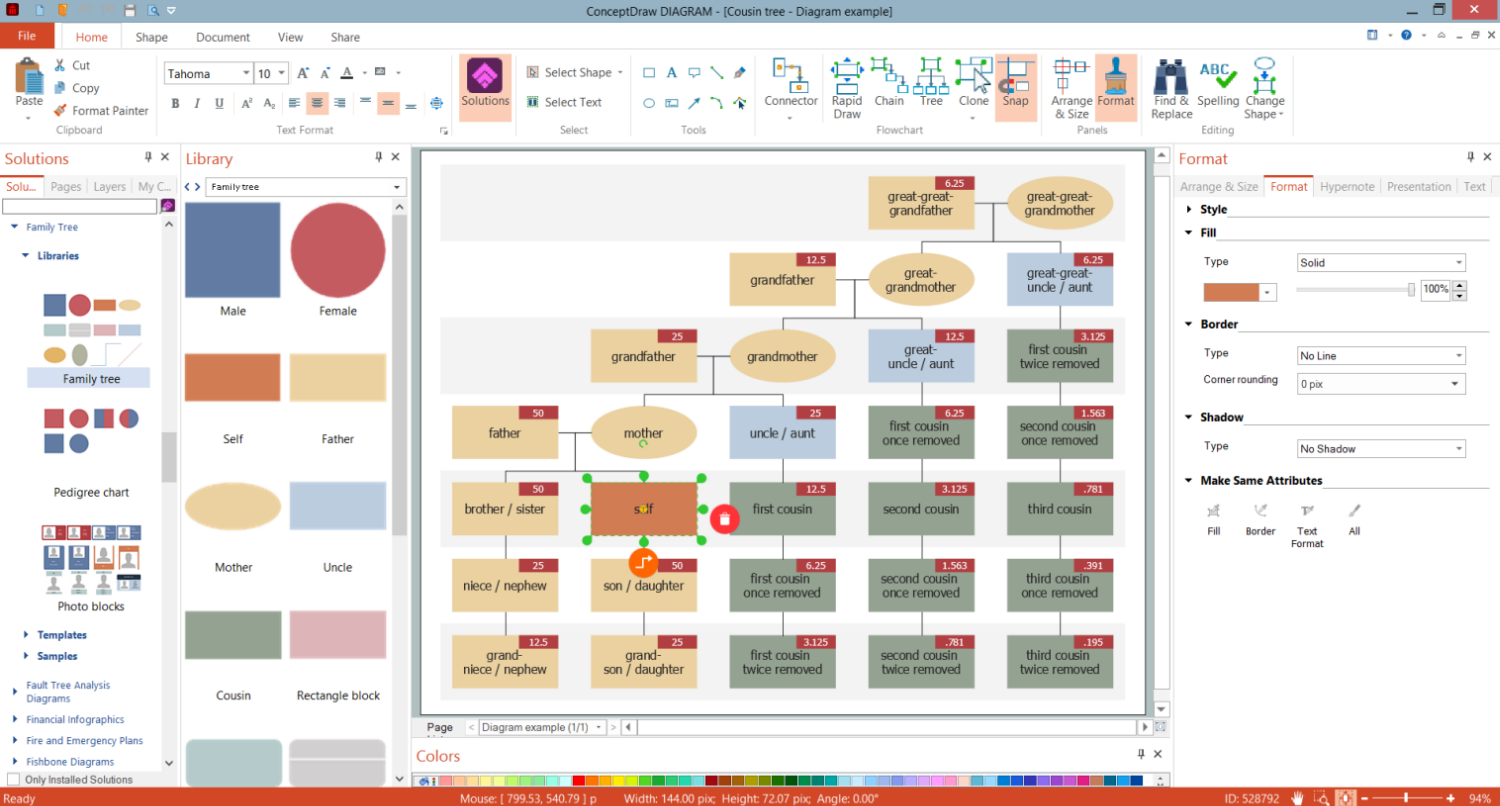
Example 1. Genealogy
The ConceptDraw DIAGRAM software and Genogram solution included to the ConceptDraw Solution Park are the best for simple designing the Genograms of any complexity. Use them to present the genealogy, family kinship in a visual view. This solution includes a lot of genogram symbols gathered in four libraries.


Design as simple family trees as complicated quick and easy in ConceptDraw DIAGRAM software using the Genogram solution. A simple family tree includes you, your parents, siblings, and grandparents. In turn, a complicated one contains in addition your aunts and uncles, cousins, great-grandparents and other relatives from elder generations. Moreover, one family tree may include all known ancestors, another one only the family members by male-line or female-line. Any other kinds are also possible.

Example 2. Genogram - Your Family Tree
The illustrations you see on this page were created in ConceptDraw DIAGRAM software using the drawing tools of the Genogram Solution. They successfully demonstrate the solution's capabilities and professional results you can achieve. An experienced user spent 5-15 minutes creating each of them.
Use the powerful tools of the Genogram Solution for ConceptDraw DIAGRAM software to create your own illustrations and diagrams of any complexity fast and easy, and then successfully use them in your work activity.
All source documents are vector graphic documents. They are available for reviewing, modifying, or converting to a variety of formats (PDF file, MS PowerPoint, MS Visio, and many other graphic formats) from the ConceptDraw STORE. The Immunology Solution is available for all ConceptDraw DIAGRAM users.