Made with
ConceptDraw
DIAGRAM 18

Fungal Diseases

Fungal diseases are caused by fungi and can affect anyone and any part of the body or several parts. There are hundreds of fungi in the environment. Fungi are microorganisms that can exist on human skin or inside the organism without any harmful action. Most people are exposed to them regularly without any adverse reaction. However, specific conditions can cause the overgrowth of fungi, their colonization, disease and its progression, symptoms, and harmful effects.

When fungi become too prevalent in a certain area of the body, organ, or system of organs and the immune system is unable to defeat them, a fungal disease occurs. The most common fungal diseases are tinea pedis or athlete’s foot, tinea corporis or ringworm, tinea cruris or jock itch, yeast infection or candida infection.

The key reason for fungi to become extremely dangerous and lead to life-threatening diseases is reduced immunity. People with a weakened immune system, patients after operations, those taking antibiotics, the elderly, the critically ill, and with severe chronic diseases are in the at-risk group for fungal infections. Unfortunately, the number of infected people continuously rises each year. It is because of the complex social and economical situation, long-term therapeutic application of antifungals, and usage of agricultural fungicides. Moreover, currently, acquired resistance of some fungi strains to antifungal drugs is a key issue that causes a global threat in counteracting fungal infections. Less susceptible fungal strains are found more and more often.

It is important to recognize the symptoms of fungal disease as early as possible to quickly treat it and prevent serious complications. If you note signs or symptoms of a fungal infection, obligatory check with your doctor. After a physical exam and discussion of symptoms, additional testing, investigation of an infected system of organs, the determining existence and the type of fungus causing the infection may be necessary. Medical testing methods include scraping of your skin or nail, testing a hair sample, making a blood test, sputum, vaginal secretion or urine test, a biopsy of organ tissue, and cerebrospinal fluid research.

Usually, the symptoms of mild fungal skin diseases include redness, rashes, cracking skin, peeling skin and are treated quickly and simply. More serious forms of fungal diseases include burning sensations, itching, swelling, stinging, feeling sick, diarrhea, tiredness, vomiting, and other symptoms. They require complicated treatment and can cause fatality if not treated.

Fungal Diseases - Infographics Design in ConceptDraw DIAGRAM

Example 1. Fungal Diseases - Infographics Design in ConceptDraw DIAGRAM

Fungal infections are contagious, they can spread from animals and from one person to another through direct contact or through shared things like towels, linen, etc. Contaminated soil, objects, or surfaces, especially in damp warm premises like public showers, pools, and locker rooms are a source of taking fungal infections.

However, basic personal hygiene and strengthen immunity help to avoid infection and prevent disease. Keep your skin clean and dry, wear flip-flops or sandals in public showers, and don't share your private items like towels, clothes, shoes, sports equipment with other people. These simple rules help to avoid fungal infections.

Most fungal skin infections are treated with creams, sprays, shampoos, gels, drops. Severe infection may require complex treatment with oral medications, pills, or injections. It is always best to turn to a doctor at the first signs or symptoms of infection to avoid disease development and possible complications.

Medical Mycology Libraries Design Elements

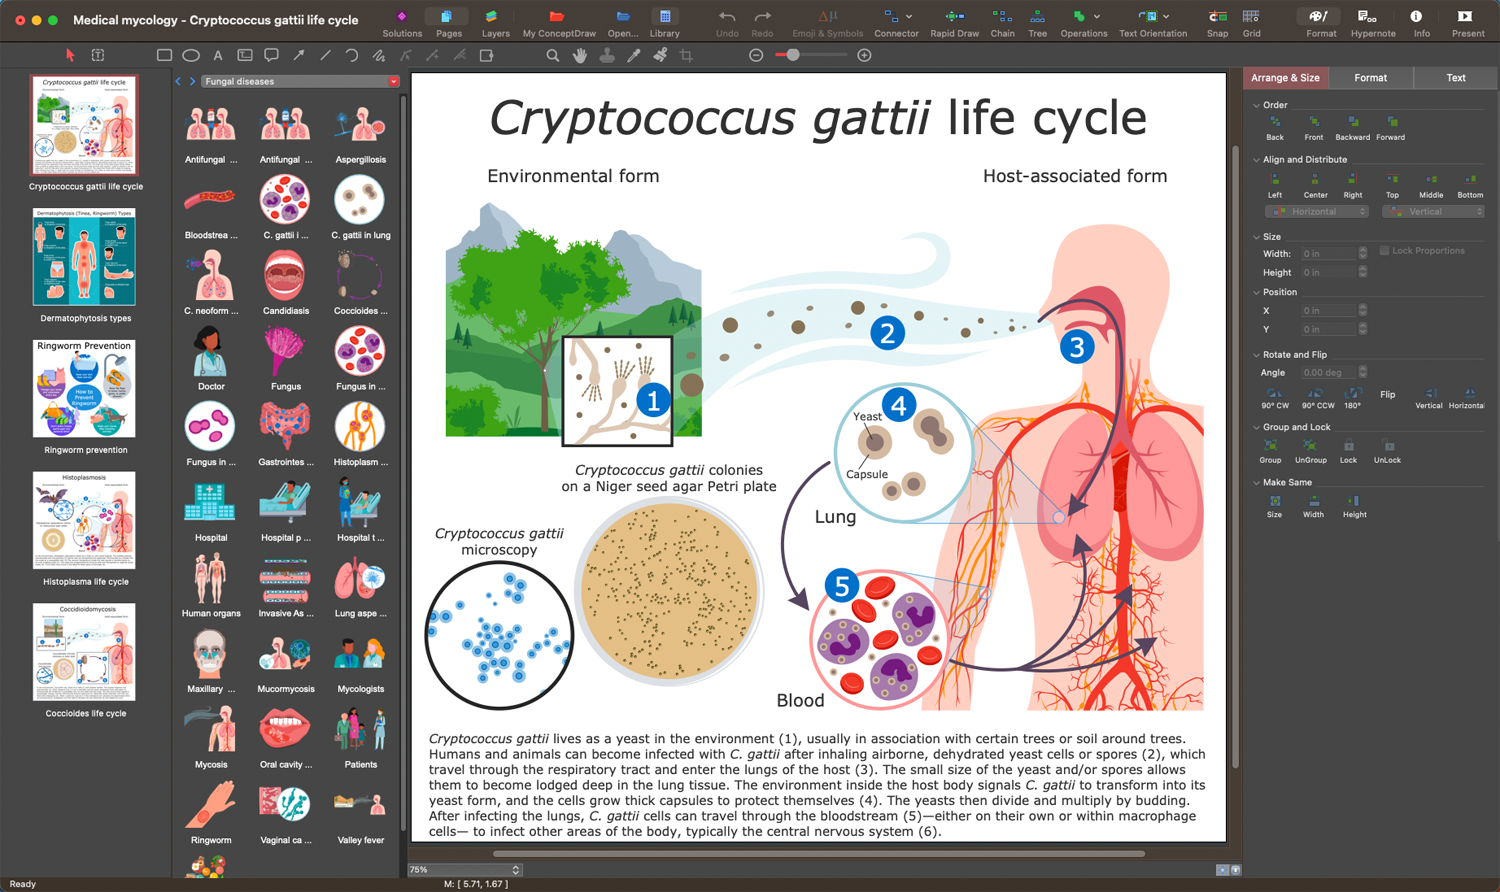
Example 2. Medical Mycology Libraries Design Elements

ConceptDraw DIAGRAM software provides the Medical Mycology solution with a wide set of predesigned vector elements and ready-made samples illustrating fungi types, fungus cell cycle, ways of spreading, and other mycology-related issues. 17 libraries with 350+ vector design objects included are incredibly effective to illustrate a variety of fungal diseases, their etiological agents, pathogens, common symptoms, and ways of treatment. These professional tools are useful for medical scientists, researchers, mycologists and microbiologists, clinical laboratory scientists, professors of medicine, students and interns, and many other stakeholders.

Human Fungal Diseases

Example 3. Human Fungal Diseases

The mycology infographics you see on this page were created in ConceptDraw DIAGRAM software using the Medical Mycology Solution. They successfully demonstrate the solution's capabilities and the professional results you can achieve. An experienced user spent 10-15 minutes creating each of these samples.

Use the powerful tools of the Medical Mycology Solution for ConceptDraw DIAGRAM software to create your own infographics and diagrams of any complexity fast and easy, and then successfully use them in your work activity.

All source documents are vector graphic documents. They are available for reviewing, modifying, or converting to a variety of formats (PDF file, MS PowerPoint, MS Visio, and many more graphic formats) from the ConceptDraw STORE. The Medical Mycology Solution is available for all ConceptDraw DIAGRAM users.

TEN RELATED HOW TO's:
Accounting is a cornerstone of any business, it’s basement. If you want to have a visual representation of your finance management, use audit flowchart symbols to document the money flow. Although some would say that accounting is boring, it is very a responsible duty. The audit flowchart symbols is supplied with ConceptDraw Audit Flowcharts solution as a vector objects library. Together with Conceptdraw Drawing capabilities it forms the helpful tool for audit process planning and setting the steps of audit by designing audit flow charts. Audit Flow charts are used to organize fiscal information tracking process as well as in accounting, finance and investment management.Audit Flowchart Symbols
Picture: Audit Flowchart Symbols
Related Solution:
Data structure diagram (DSD) is intended for description of conceptual models of data (concepts and connections between them) in the graphic format for more obviousness. Data structure diagram includes entities description, connections between them and obligatory conditions and requirements which connect them. Create Data structure diagram with ConceptDraw DIAGRAM.Data structure diagram with ConceptDraw DIAGRAM
Picture: Data structure diagram with ConceptDraw DIAGRAM
Diagramming is an astonishing way to visualize business processes. The list of the most common business process flowchart symbols is quite long starting from basic flowcharts, continuing with SIPOC diagrams. Business process modeling was never easier than now, with special ConceptDraw Business Process Mapping solution. To carry out all professional standard requirements for business processes mapping, it is necessarily to follow the special graphical notations. ConceptDraw Business Process Mapping solution offers an exhaustive suite of tools to aid business process mapping. There are three vector libraries SIPOC Diagrams, Business Process Flowcharts, and Swim Lanes that contains totally more than 50 symbols of standard BPM notations. This is all that professionals need to effectively evaluate and manage quality in business processes.Business Process Flowchart Symbols *
Picture: Business Process Flowchart Symbols
Related Solution:
If you need to describe some process, diagramming is a perfect tool for almost any imaginable purpose. The set of the most commonly used flow charts symbols is quite wide and includes symbols for operations, processes, data inputs and outputs. You can see the full list of all the symbols used for flowcharting in Flowcharts solution from Diagrams area in ConceptDraw Solution Park. A flow chart is often used for visual representation of a sequential process flow. The flowchart approach to any process is to divide it into some sequential actions. What makes a flow chart so popular and clear to make out is the set of standard flowchart symbols that has the same reading independently from processes described with their applying. The current drawing represents the vector library containing the pack of standard flowchart symbols. This library is supplied with ConceptDraw Flowcharts solution.Flow Chart Symbols
Picture: Flow Chart Symbols
Related Solution:
A flowchart is a simple but very functional tool when it comes to understanding a workflow or to removing unnecessary stages from a process. When drawing flowcharts, keep in mind that there are four common types of flowcharts, like document flowcharts and data flowcharts that show control over a data or document flow over a system. To show controls on a physical level, use system flowcharts. In addition, to show controls in a program, you can draw a program flowchart. This flowchart diagram represents the piece of an article editing process, that involves the author and editor. It was created using the Basic Flowchart notation that consists from the basic flowchart symbols. The start and the end of the process are indicated with "Terminator" symbols. The "Process" symbols show the action steps consisting from making edits and searching for a compromise, when the author does not agree with the suggestions of the editor. The "Process" symbol is the general symbol in process flowcharts. The "Decision" symbol indicates a branching in the process flow. There are two branches indicated by a Decision shape in the current flowchart (Yes/No, Disagree/Agree). This basic flowchart can be used as a repeating unit in the workflow diagram describing the working process of some editorial office.Types of Flowcharts *
Picture: Types of Flowcharts
Related Solution:
Use ConceptDraw DIAGRAM diagramming and business graphics software to draw your own flowcharts of computer algorithms.Process Flow app for macOS *
Picture: Process Flow app for macOS
Related Solution:
The ConceptDraw Flowchart component includes a set of samples and templates. This geathered as flowchart maker toolbox which focused on drawing flowcharts of any industry standards.Flowchart Components
Picture: Flowchart Components
Related Solution:
Data flow diagrams are the graphical tool, used in the visualization of data flow of some data processing systems. It is the valuable process modeling tool. Also designing DFD is the important component of the initial part of any information system development project. The standard symbols are used to represent the interaction of a system components and how various kinds of components influence on data flow. The ConceptDraw Data Flow Diagrams solution is design to assist professional software engineers in making DFDs according to Gane and Sarson, and Yourdon and Coad notations. Do you imagine yourself as a successful IT specialist? To your mind, they all use data flow diagram examples to learn and to get inspired. Aren’t you still with us?Data Flow Diagram Examples *
Picture: Data Flow Diagram Examples
Related Solution:
ConceptDraw DIAGRAM is a world-class diagramming platform that lets you display, communicate, and present dynamically. It′s powerful enough to draw everything from basic flowcharts to complex engineering schematics. Video tutorials on ConceptDraw products. Try it today!Business  Process Mapping — How to Map a Work Process *
Picture: Business Process Mapping — How to Map a Work Process
Related Solutions:
Event-Driven Process Chain Diagrams for improvement throughout an organisation. ConceptDraw DIAGRAM - software that reduces the time needed to create a business process model.Graphical Symbols to use in EPC diagrams *
Picture: Graphical Symbols to use in EPC diagrams
Related Solution:
ConceptDraw
DIAGRAM 18