Equestrian Vector
Equestrian sport is commonly known as horse riding. This sport supposes training the horses and riding on the horse's back, reining, and vaulting. It includes recreational activities, taking part in competitions, horse racing, team sports on horseback, horse rodeo sports. Equestrian sport is an absolute harmony of a rider and horse. It is a successful combination of skillful manipulation of a rider with the beauty and power of his horse. Their collaborative work allows dealing with all obstacles and winning in competitions.
First horses were domesticated approximately 3500 BC and have played an important role throughout human history all over the world. Since ancient times, they were used as working animals, in agriculture, transportation, during military campaigns in light and heavy cavalry. Horses that lived in North America died out at the end of the Ice Age and were brought back only in the 15th century by European explorers.
Today horses are also trained for practical working purposes like police work, transportation. They are involved in search and rescue operations, fox hunting, work in farming, controlling herd animals on a ranch. Horses participate in horse shows, traditional ceremonies, parades. Plus they are used for therapeutic purposes to improve human health and emotional development.
Horse riding requires a lot of useful skills from a rider, including great physical training, endurance, self-control, self-possession, equanimity, patience. It is a large work to set contact with a horse, to understand and train it, but regular training leads to success.
Equestrianism was introduced as a sport in the 1900 Summer Olympics games. Since that time equestrian sports like dressage, show jumping, and eventing are recognized worldwide and are included in the Olympics. More equestrian events are included in the World Equestrian Games organized by the International Federation for Equestrian Sports. Among them are combined driving, endurance, reining, and vaulting.
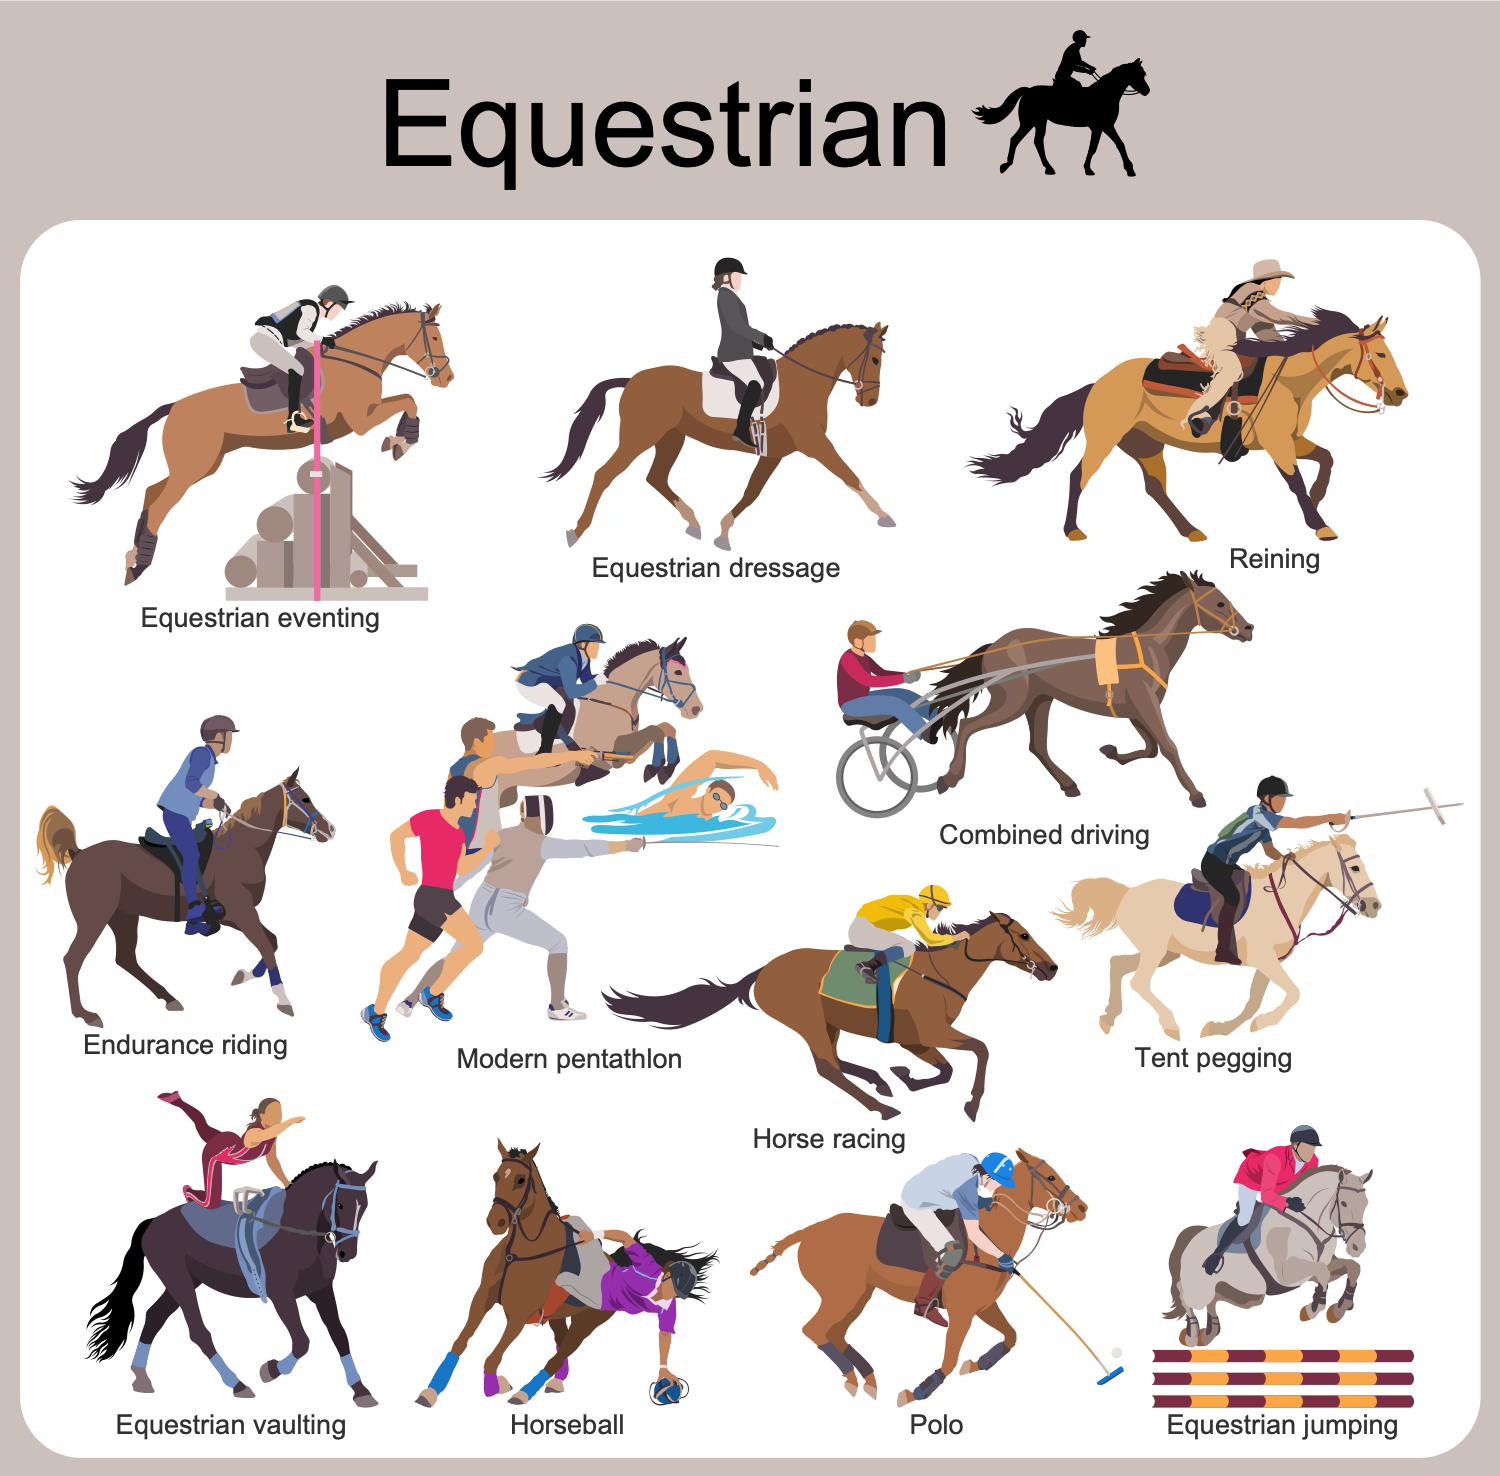
Example 1. Equestrian Vector Infographics Design
Equestrian sports includes many types of horse competitions from classical to intense ones:
- Equitation — horsemanship when the riders are evaluated on form, style and ability.
- Dressage — riders and horses perform a series events and movements natural for horses on a loose, it involves the progressive training of the horse to a high level of collection, obedience, and impulsion.
- Vaulting — gymnastics and dance performed on a horseback.
- Show jumping — jumping through sets of obstacles like logs, stone walls, banks, ditches, and water in a given order, with the fewest knockdowns of obstacles' parts and within a specific time.
- Cross-country — jumping over 30 to 40 obstacles within a fixed time.
- Endurance riding — competing in races over very long distances.
- Reining — style of western riding originating from the Spanish conquistadors. It is a guiding horses by riders through a precise pattern of spins, circles, and stops. This demonstrates the agility and obedience of the horse and the unity of horse and rider.
- Eventing — competition in three types of races, dressage, cross-country and show jumping.
- Gymkhana — multi-game equestrian event when the talents of the horses and their riders are demonstrated.
- Western pleasure — horse show competition where horses' manners, composure, performance, and quality are judged.
- Harness classes — horses are driven rather than ridden; their manners, performance and quality are evaluated.
- In-hand breeding — horses are led by a handler, the conformation and suitability as a breeding animal are judged.
- Carriage driving — competitive horse driving when one, two, or four horses are harnessed to a vehicle and controlled by a person sitting in the carriage.
Horse racing is also popular and includes different types:
- Under saddle thoroughbred horse racing and steeplechasing on a track.
- Distance racing and endurance riding over a given measured distance, typically 50 to 100 miles for top-level races and 25–20 miles for newcomers.
- In harness horse racing.

Example 2. Summer Sports Libraries Design Elements
ConceptDraw DIAGRAM software enhanced with the Summer Sports solution is the best software to design illustrations and infographics related to horse riding and equestrian sports. It offers a numerous collection of vector design elements — equestrian, gymnastics, ball games, Athletics, racing, racquet sport, etc. You can present general information about equestrian sports, make an overview of a variety of types of horse competitions with their specificities, show local horse riding and racing opportunities in your area. Professional equestrian vector illustrations designed in ConceptDraw DIAGRAM perfectly suit to be shared on the web, in social media, in magazines and are inspired to try equestrian.

Example 3. Summer Sports Solution in ConceptDraw STORE
The infographics you see on this page were created in ConceptDraw DIAGRAM software using the Summer Sports Solution and included pre-made pictograms and clipart. They successfully demonstrate the solution's capabilities and professional results you can achieve. An experienced user spent 10-15 minutes creating each of these samples.
Use the powerful tools of the Summer Sports Solution for ConceptDraw DIAGRAM software to create your own infographics and diagrams of any complexity fast and easy, and then successfully use them in your work and personal activity.
All source documents are vector graphic documents. They are available for reviewing, modifying, or converting to a variety of formats (PDF file, MS PowerPoint, MS Visio, and many more graphic formats) from the ConceptDraw STORE. The Summer Sports Solution is available for all ConceptDraw DIAGRAM users.