Engineering Diagram
An Engineering Diagram is a technical drawing used to show detailed technical information about an object, product, component, or part, its geometry, structure, dimensions, assemblies, requirements, and tolerances. All listed details are necessary for correct manufacturing.
Often multiple drawings are created for a single object. These are engineering drawings of two types - part drawings and assembly drawings. The part drawing shows the construction of an individual part of the object. Several part drawings are interconnected together by an assembly drawing. The last one shows how the individual components are combined together, attached in relation to each other, and uses the numbers to indicate the appropriate drawings of the parts. The more complex the engineering object is, the bigger number of drawings is necessary. Therefore for complex projects, a clear and logical numbering system should be used to increase productivity and reduce the time to search parts in the drawing.
Engineering diagrams use special pictograms, symbols, and abbreviations to show the components. Different types of lines are used for different purposes, to show both visible and hidden parts. A continuous line shows the physical boundaries of an object and its thickness can vary. Thick lines are used for external contours and thin for inner ones. Hidden lines show the parts invisible for our look from a chosen angle. The center or axis line is used to show the holes and symmetricity of the object. Dimension lines have two arrowheads between the extension lines and also a measurement on top or inside. The legend and additional textual explanations may be also included in the Engineering diagram. This makes understanding the drawings simple. Often they include detailed information about the type and quantities of used materials.
Engineering diagrams are an obligatory part of project specifications for engineers, designers, architects, electricians, and other workers to realize a project, production process, assembly or welding, and further maintenance. Engineering diagrams include different types of diagrams: Circuit diagrams, Wiring plans, Electrical schematics, One-line diagrams, and many more, and are used in various industries like electricity, aircraft manufacturing, oil and gas industry, and others.
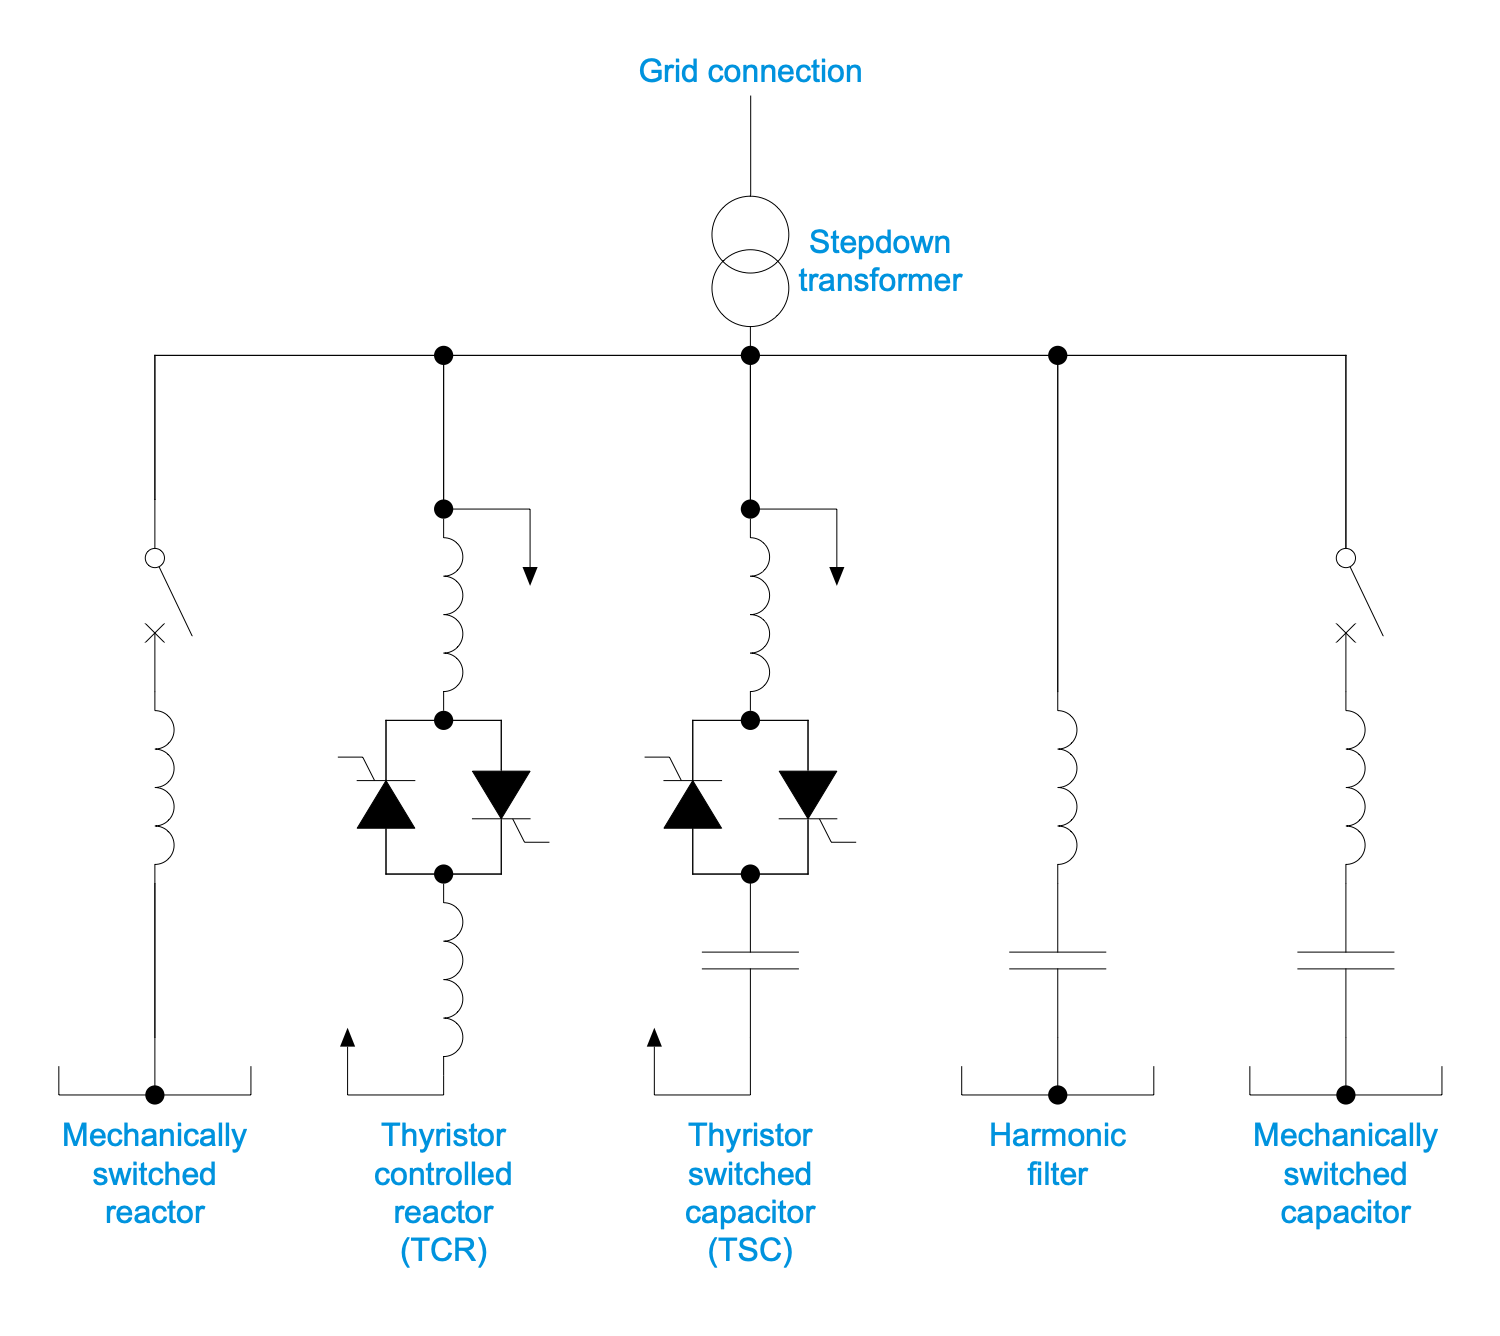
Example 1. Engineering Diagram - Static VAR Compensator
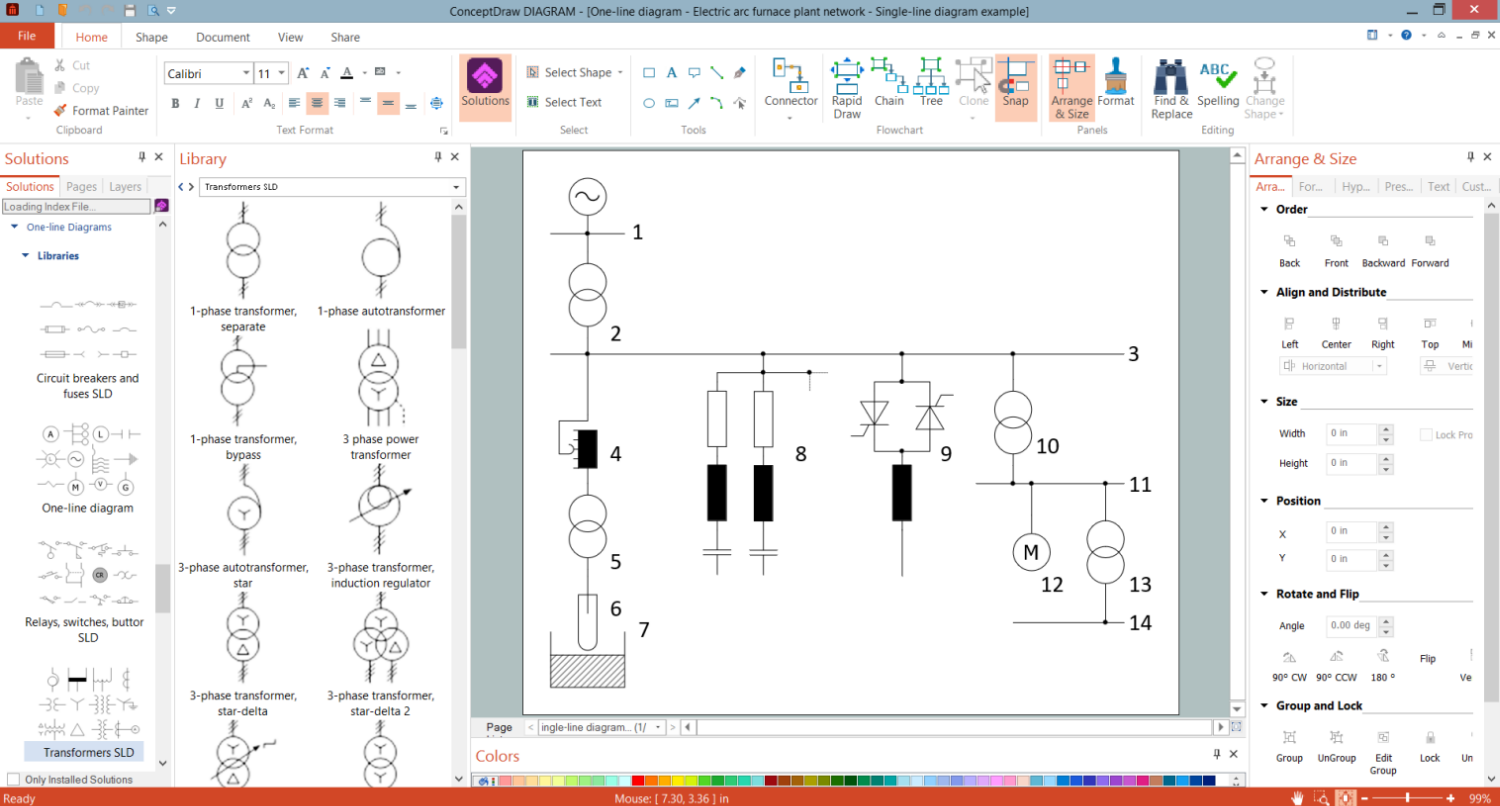
ConceptDraw DIAGRAM enhanced with the One-line Diagrams solution makes designing accurate engineering diagrams and drawings easy and handy. Drawing in the special application has many advantages. All included instruments are useful and convenient and make designing Engineering diagrams much more easier than manual drafting. All symbols included in the solution libraries are standardized. Design easily the Engineering diagrams and manufacturing blueprints, and give a good visual representation of the desired item according to generally accepted standards.

Example 2. Engineering Diagram - Breaker and a Half Switchyard Design Concept
One-line Diagrams solution includes 4 libraries:
- One-Line Diagram
- Circuit Breakers and Fuses SLD
- Relays Switches Buttons SLD
- Transformers SLD
The numerous vector elements from these libraries are helpful to design monopolar HVDC, bipolar HVDC, electric substation and differential protection schematics, electrical circuit configurations, voltage topologies, and many more electrical engineering diagrams.

Example 3. One-Line Diagrams Solution in ConceptDraw STORE
The Engineering Diagram samples you see on this page were created in ConceptDraw DIAGRAM software using the drawing tools of the One-line Diagrams Solution. These examples successfully demonstrate the solution's capabilities and the professional results you can achieve using it. An experienced user spent 5-15 minutes creating each of these samples.
Use the drawing tools of the One-line Diagrams solution to design your own Engineering diagrams and schematics quick, easy, and effective.
All source documents are vector graphic documents. They are available for reviewing, modifying, or converting to a variety of formats (PDF file, MS PowerPoint, MS Visio, and many other graphic formats) from the ConceptDraw STORE. The One-line Diagrams Solution is available for ConceptDraw DIAGRAM users.