Made with
ConceptDraw
DIAGRAM 18

Data Flow Diagram Free

A Data Flow Diagram (DFD) is a type of flowchart, which shows graphically the flow of data through a business process or information system. It is a convenient way to document the process or system, design its architecture, and realize an initial top-down analysis of a system. Because DFD gives a clear understanding of process and system operations, the interactions and data exchanges between the processes, shows how data is transferred from the inputs to the file storage with generating the reports.

Data Flow Diagram focuses on data and information and helps discover potential problems and improve efficiency when developing systems. It shows the boundaries of a system, the sequence of processes that are done in a particular order to achieve a particular goal, how data enter a system, how are processed, and where they go. The arrows describe the flow of data and information.

Data Flow Diagrams are equally beneficial for simple and complex processes or systems and are designed both as simple overviews and detailed ones. One differs two types of DFDs: logical and physical, which provide different perspectives of the same data flow and give together a complete understanding of an entire process. Logical DFD describes the system focusing on the information required for its operation. Physical DFD gives information about the involved entities and how the system is or will be implemented.

Logical DFD is useful to show business information, the flow of business actions. It clarifies business activities, types of functionalities in a particular business and is a powerful tool for business analysis and improvement of business processes. Physical DFD shows how the system is organized and operates, and how data move through it. It includes hardware, software, files, and ensures that the processes described in the logical DFD will be implemented correctly. Usually, a logical DFD is less complex than a physical DFD, but the physical is created on its basis and is more detailed.

Data Flow Diagrams are used for analysis and modeling of systems in different areas. These include technical areas, software engineering, business management, database development, business analysis, system structure analysis, business process re-engineering, agile development, and others. Visualization using DFD is useful to explain processes and make them memorable. DFDs are used to analyze the systems and improve them, troubleshoot, find and eliminate inefficiencies, steps that might be missed or not fully understood. They are also a powerful tool for communication and collaboration.

A clear understanding of processes in a company helps to streamline them, improve the company's operation, and make your business successful. DFDs help to improve customer service, design more agile processes, increase competitiveness in the market, cut operational costs, measure progress, encourage system improvement and development. Being used in software development, Data flow diagrams help to design the application and show its architecture before its coding. They help engineers and developers understand the needs and wants of customers. DFDs easier the work with complex databases by clarifying the movement and storing of data, support ensuring cyber security and data protection.

Data Flow Diagram Free in ConceptDraw DIAGRAM

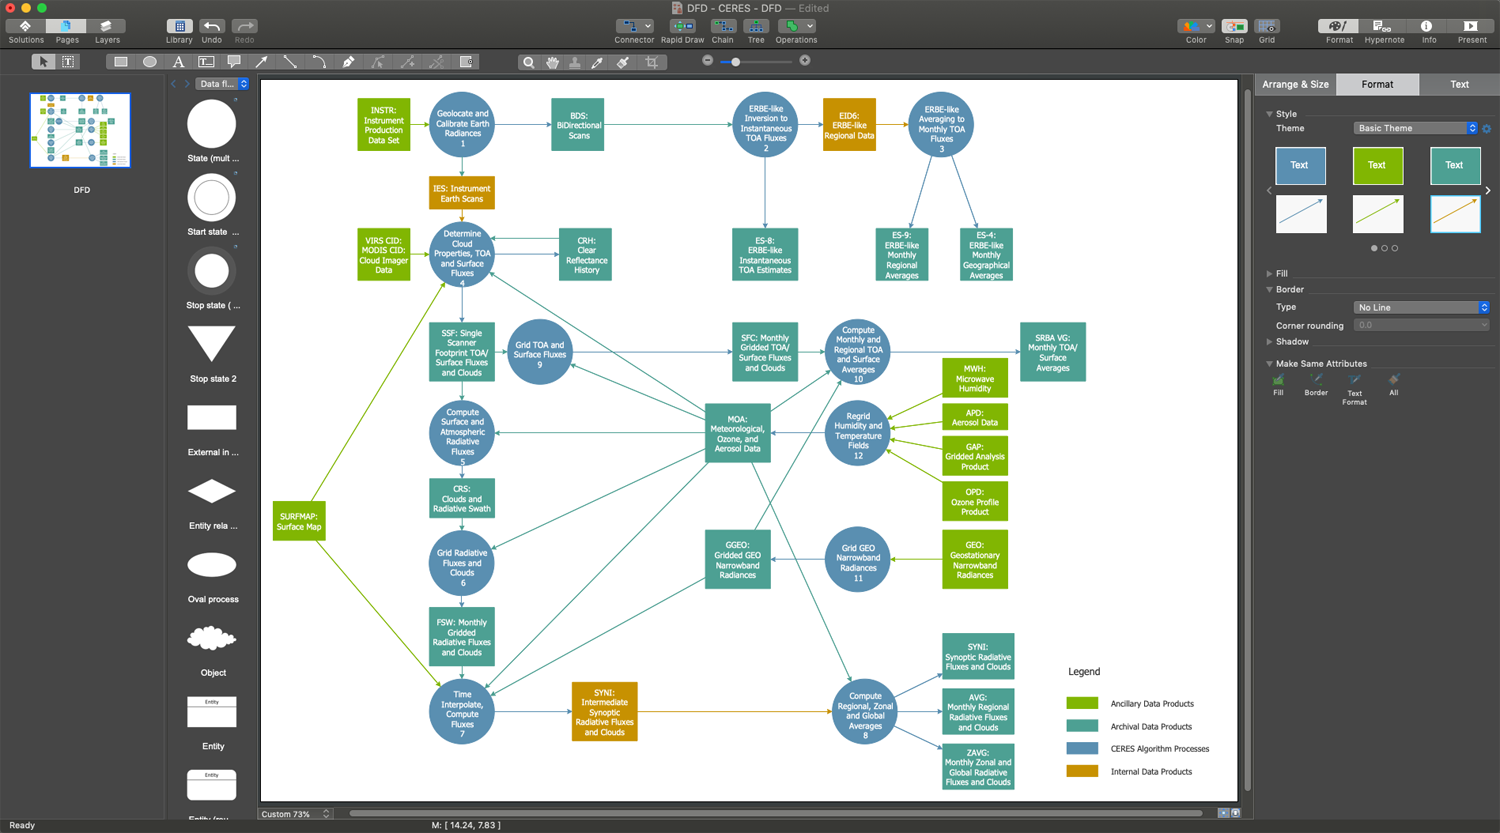
Example 1. Data Flow Diagram Free in ConceptDraw DIAGRAM

Data Flow Diagrams can range from simple, which give a process overview to complex multi-layered diagrams including a lot of details about the system. The complexity of DFD also depends on the complexity of the system it represents. As a rule, Data Flow Diagram includes 3-4 levels numbered as 0, 1, 2, 3, and rarely beyond. The level of detail determines how deep the diagram shows a system, its processes and subprocesses.

DFD Level 0 is a basic level called a Context diagram, it shows the overall system or high-level process overview and its relationships to external entities. DFD Level 1 is a more detailed breakout of the processes of Level 0 and shows the main functions and subprocesses within the system. DFD Level 2 provides more deeper description than shown at Level 1. More levels are also added if needed.

The basic symbols used to create a Data Flow Diagram are standardized by Yourdon & Coad and Gane & Sarson notations and include rectangles, circles, triangles, cylinders, arrows, text labels, and other symbols to show entities, data stores, and other components. Being standardized, these symbols make your diagram comprehensive for all team members and easy to implement. The main difference in these notations is that Yourdon-Coad notation uses circles to show processes, while Gane-Sarson notation uses rectangles with rounded corners.

Data Flow Diagrams Solution- Libraries Design Elements

Example 2. Data Flow Diagrams Solution- Libraries Design Elements

ConceptDraw DIAGRAM extended with Data Flow Diagrams (DFD) solution is a powerful software for designing a Data Flow Diagram free and easily. Use the specialized design elements — Yourdon and Coad notation and Gane-Sarson notation, and pre-made templates to show the flow of data through your system as a Data Flow Diagram in minutes. The included DFD examples are also helpful for designing your own diagrams. You can customize any of them relative to your needs, your processes, external entities, data stores, data flow, etc.

DFD — Process of Account Receivable

Example 3. DFD — Process of Account Receivable

The Data Flow Diagram examples you see on this page were created in ConceptDraw DIAGRAM using the objects from the libraries of Data Flow Diagrams solution. These samples demonstrate the solution's capabilities and the professional results you can achieve. An experienced user spent 15 minutes creating each of these samples.

Use the Data Flow Diagrams solution for designing your own Data Flow Diagrams quick, simply, and effectively.

All source documents are vector graphic documents. They are available for reviewing, modifying, or converting to a variety of formats (PDF file, MS PowerPoint, MS Visio, and many graphic formats) from the ConceptDraw STORE. The Data Flow Diagrams Solution is available for all ConceptDraw DIAGRAM users.

TEN RELATED HOW TO's:
Agile methodology is an excellent alternative to waterfall and traditional sequential development. ConceptDraw DIAGRAM software extended with SCRUM Workflow solution is ideal for quick and easy designing various diagrams, charts, mind maps and schematics illustrating software development using Agile methodologies, and in particular Scrum methodology.Agile Methodology *
Picture: Agile Methodology
Related Solution:
Any information system receives data flows from external sources. In order to visualize them there is a list of data flow diagram symbols that describes how the system components cooperate. If you want to create a data flow diagram, ConceptDraw DIAGRAM Solution Park has DFD Library that contains both Yourdon and Gane-Sarson notations. This figure shows the content of vector libraries, delivered with ConceptDraw solution for data flow diagram (DFD). There are three libraries composed from about 50 vector objects used to make data flow diagrams. They include a complete set of objects utilized by Yourdon-Coad and Gane-Sarson notations - two primary notations that are apply for data flow diagramming. Also, one can discover additional "Data flow diagram (DFD)" library that provides a data flow diagram elements for designing level 1 and context-level data flow diagrams.Data Flow Diagram Symbols. DFD Library *
Picture: Data Flow Diagram Symbols. DFD Library
Related Solution:
There are many ways to define the flow of information within a system. Structured-systems analysis method often uses data flow diagrams to show data flow, data storages and data processing visualization. These diagrams are easy to develop and quite useful. Here is a dataflow diagram presenting an example of the manufacturing process flow. The oval process shapes represent a process that controls data within the current system. The process may produce data or make some action based on data. Data flows are represented by lines. They show the movement of information through the system. The direction of the data flow is depicted by the arrow. The external entities are shown by rectangles. They represent the external entities interacting with the system. The data store objects (unclosed rectangles) are used to show data bases participating in a process flow.Data Flow Diagram *
Picture: Data Flow Diagram
Related Solution:
There are numerous articles about the advantages of flowcharting, creating business graphics and developing different charts. Nevertheless, these articles are almost useless without the main component - the examples of flowcharts, org charts and without a fine example, it is difficult to get all the conveniences of creating diagrams. You can find tons of templates and vivid examples on Solution Park. This illustration shows a variety of business diagrams that can be created using ConceptDraw DIAGRAM. It comprises a different fields of business activities: management, marketing, networking, software and database development along with design of infographics and business illustrations. ConceptDraw DIAGRAM provides a huge set of sample drawings including business process modeling diagrams,, network diagrams, UML diagrams, orgcharts, DFD, flowcharts, ERD, geographical maps and more.Examples of Flowcharts, Org Charts and More
Picture: Examples of Flowcharts, Org Charts and More
Related Solution:
When we think about programming, we usually imagine sleepless nights spent on writing kilobytes of code. However, from another point of view, Software development with ConceptDraw DIAGRAM makes a programmer's life endlessly easier. This tool is unique to fulfill all your needs in short period of time. Over the recent years object-oriented methodology has become more and more widespread. Thanks to this methodology developers manage to deal with growing complexity of applications. More and more programs are written in such programming languages as C++, Java, Visual Basic and Object Pascal. However, the complexity of the designed systems imposes extended requirements as to design of graphic documentation. ConceptDraw possesses powerful tools for designing of technical documentation for object-oriented projects. The libraries included in the package allow to easily draw class hierarchies, object hierarchies and diagrams of data flows with the use of the most popular notations, including UML and Booch notations. And the library for projecting COM-interfaces will spare developers of ActiveX-servers a headache.Software development with ConceptDraw DIAGRAM  *
Picture: Software development with ConceptDraw DIAGRAM
IT world is extremely rational and logical. So what can be more precise than Software Diagrams to rate the results of work? Visual statistics is the best way to understand the data. This figure demonstrates the data flow diagram (DFD), which was created to describe the electronic system of custom purchase. This is the process of buying using electronic bar code scanning system. Such systems are used in large stores. The cashier scans the bar code, the system outputs the data on the price of the goods and carries out a purchase process. This DFD utilizes the Gane/Sarson notation. To create it The ConceptDraw DFD solution has been applied.Software Diagrams
Picture: Software Diagrams
Meeting ice hockey rules one should learn ice hockey rink terms, lines, zones etc. ConceptDraw DIAGRAM is an advanced drawing software that allows you produce ice hockey rink depiction of any complexity, from simple sketch drawing to detailed one as on example below.Ice Hockey Rink Dimensions *
Picture: Ice Hockey Rink Dimensions
Related Solution:
When we start to speak about databases, we must always mention database structure visualization. One of the most common ways to do it is to create an entity relationship diagram, and to put appropriate symbols on it. It is important either for database projecting and for its' future maintenance. Entity Relationship Diagram describes data elements and their relationships within a database. There are a set of special symbols that depict each element of an entity relationship diagram. Entities - represents some stable components such as supplier, employee, invoice, client, etc. Relation symbols show how the entities interact. Attributes define characteristics of the relationships. Attributes can be one-to-one or many-to-many. Physical symbols is used in the physical models. They represent items such as fields, tables, types and keys. ERD physical symbols are the building material for the database. Notation lines are used to illustrate the relationships. The most common method is Crow’s Feet notation. You can use ConceptDraw Entity-Relationship Diagram (ERD) solution to represent a database using the Entity-Relationship model.Entity Relationship Diagram Symbols
Picture: Entity Relationship Diagram Symbols
Related Solution:
The SWOT Analysis solution contains easy-to-use mind map templates that help identify Strengths, Weaknesses, Opportunities, and Threats, as well as outputs to ConceptDraw DIAGRAM for presenting analysis results.SWOT Analysis *
Picture: SWOT Analysis
Related Solution:
The recruitment process often requires design and use of various HR flowcharts, diagrams, attractive illustrations.Recruitment
Picture: Recruitment
Related Solution:
ConceptDraw
DIAGRAM 18