Antifungal Therapy
Fungi grow as yeasts, molds, and their combinations and reproduce through small spores. The fungi spores are found everywhere and in all kinds in the environment, in air, soil, on wood, surfaces, items, skin, become airborne and through direct contact. However, only some fungi species cause diseases in people and animals. Fungi can live on people's skin and inside the organism but don't cause problems to healthy people with a strong immune system. However, fungal infections are life-threatening for people who have autoimmune diseases, HIV, cancer, people after surgeon operations, organs or stem cells transplants.
Fungi can cause a variety of conditions. Mostly they affect the skin, nails, mucous membranes, and respiratory system. The most dangerous diseases caused by fungi include meningitis, aspergillosis, pneumocystis pneumonia, ocular histoplasmosis syndrome, valley fever, candidemia, rhinosinusitis. People with the weak immune system are more predisposed to fungal infections and require antifungal medications.
Antifungal therapy is the application of pharmaceutical fungicides, medicines, and drugs to treat fungal infections and prevent mycoses. There are many types of fungal infection and respectively there are several types of antifungal drugs used to fight fungal infections.
Antifungal drugs have various mechanisms of impact, they can directly kill fungal cells or prevent their multiplication and growth. Parts of the cell that the antifungal drugs target include its protective parts: fungal cell membrane and cell wall. Their damage can cause the cell's leak and die.
There are applied local or systemic antifungals depending on the fungal type, severity of infection, degree of damage, and condition. As a rule, systemic antifungals are taken orally or intravenously, while local antifungals are used topically. Usually, local antifungals are sold without a doctor's prescription and more serious antifungal medicines are prescribed. Antifungal medicines exist in varied forms: pills, capsules, drops, liquids for injections, vaginal suppositories, cream, gel, ointment, and spray.
Antifungal pharmaceuticals include:
- Azoles interrupt producing of an enzyme used in the fungal cell membrane creation. As a result, the cell membrane becomes unstable, leaks and deaths. Azoles are the most commonly used antifungals and include two groups: imidazoles and triazoles. These include ketoconazole, clotrimazole, miconazole, fluconazole, fosfluconazole, voriconazole, itraconazole, posaconazole, isavuconazole.
- Polyenes make the fungal cell wall porous and prone to bursting. These are nystatin and amphotericin B.
- Allylamines also interfere with an enzyme involved in the creation of the fungal cell membrane. Terbinafine is one of the allylamines.
- Echinocandins suppress an enzyme involved in the creation of the fungal cell wall. This group includes micafungin, anidulafungin, caspofungin.
- Griseofulvin prevents the fungal cell from multiplying by stopping its ability to divide itself.
- Flucytosine causes interference to the fungal cell to produce nucleic acids and proteins. As a result, the cell cannot grow and multiply.
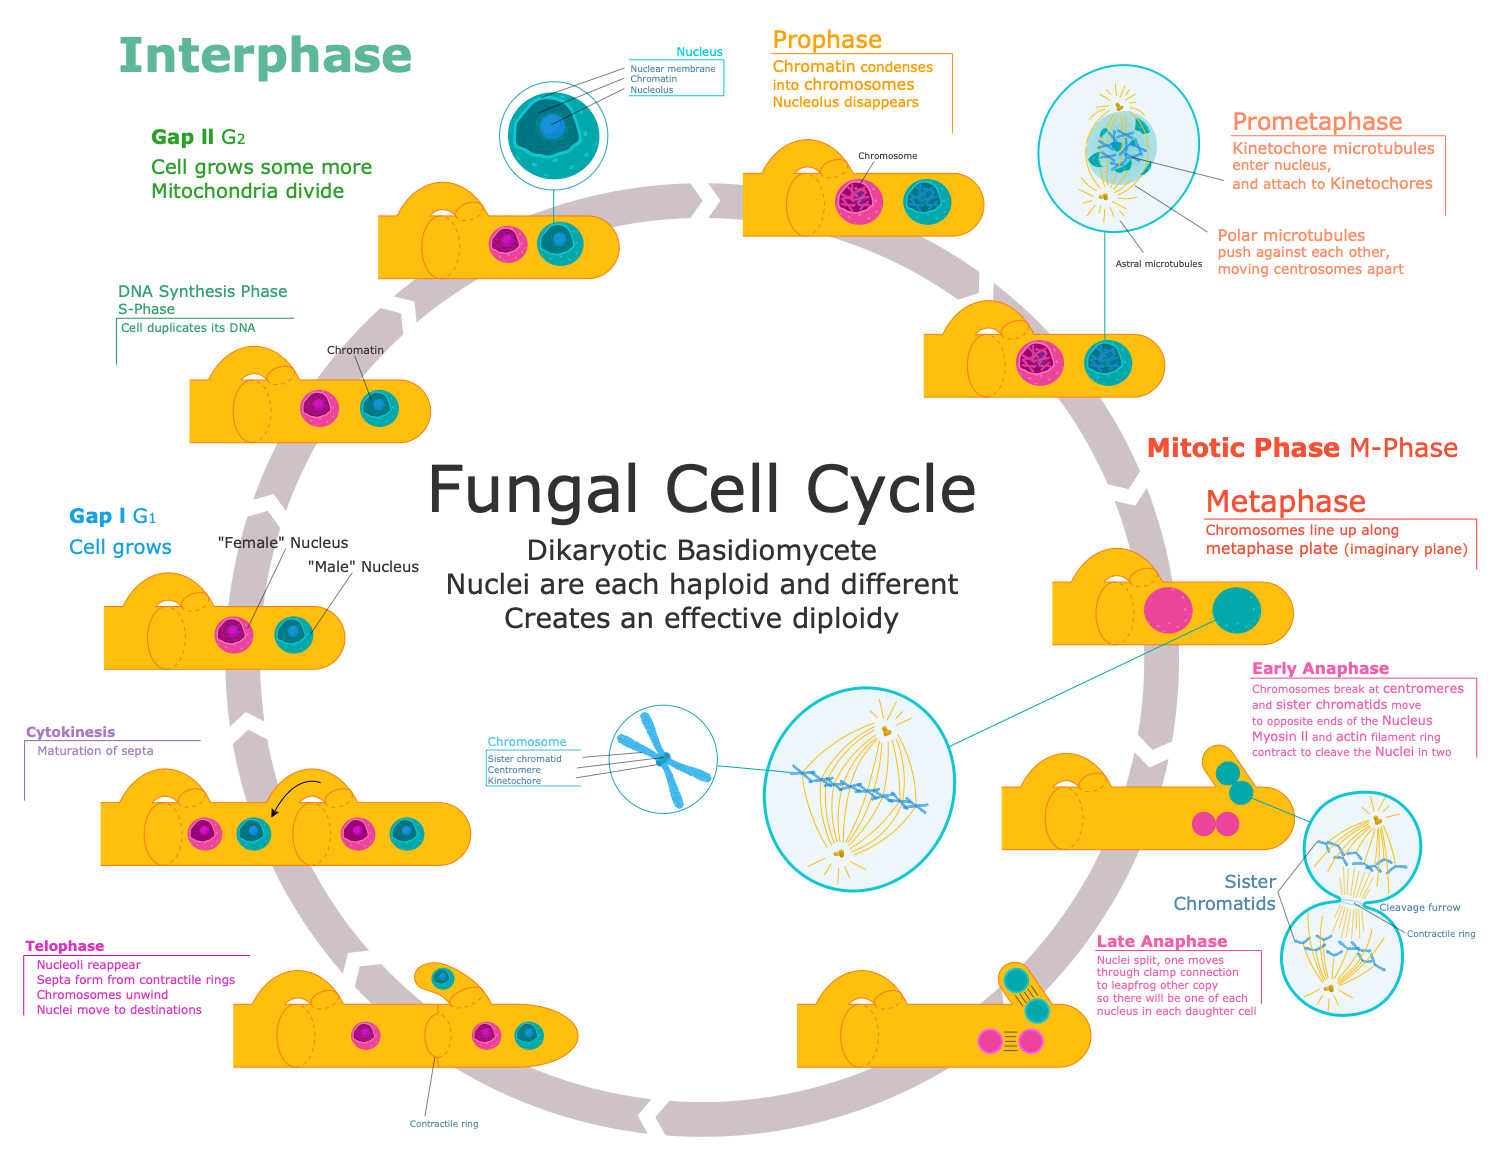
Example 1. Antifungal Therapy - Fungus Cell Cycle
As any medicines, antifungals may cause side effects like allergic reactions, redness, itching, burning, rash, feeling sick, tummy pain, diarrhea, tiredness, vomiting, and liver damage. Therefore, consult the doctor before taking antifungals and check the information that comes with the medicines. Stop using the medicine if you have some severe side effects. Be especially careful when treating children and babies.
Depending on the severity of the disease the treatment can take from several days to weeks, months, or even years to clear up the fungal infection from the organism.
The greatest difficulty is the antifungal resistance in Aspergillus, Cryptococcus, Coccidioides, and other types of fungi when they no longer respond to treatment. This severely complicates the treatment. Some fungi can mutate or be naturally resistant to certain antifungals. Taking antifungals for a long time, skipping doses, taking a too-low dose, or stopping treatment too soon also can cause the development of resistance.

Example 2. Antifungal Library Design Elements
The easiest way to design thematic mycology infographics, compile an overview of antifungal medicines and outline the schematics of complex antifungal therapy and immunotherapy is by using the powerful drawing tools Medical Mycology solution for ConceptDraw DIAGRAM software. It includes a set of samples and a huge collection of predesigned vector elements from the subject area, collected in 17 libraries and including the Antifungal library with all variety of clipart of antifungal medicines.

Example 3. Antifungal Resistance in Aspergillus
The mycology infographics you see on this page were created in ConceptDraw DIAGRAM software using the Medical Mycology Solution. They successfully demonstrate the solution's capabilities and the professional results you can achieve. An experienced user spent 10-15 minutes creating each of these samples.
Use the powerful tools of the Medical Mycology Solution for ConceptDraw DIAGRAM software to create your own infographics and diagrams of any complexity fast and easy, and then successfully use them in your work activity.
All source documents are vector graphic documents. They are available for reviewing, modifying, or converting to a variety of formats (PDF file, MS PowerPoint, MS Visio, and many more graphic formats) from the ConceptDraw STORE. The Medical Mycology Solution is available for all ConceptDraw DIAGRAM users.
TEN RELATED HOW TO's:
When trying to figure out the nature of the problems occurring within a project, there are many ways to develop such understanding. One of the most common ways to document processes for further improvement is to draw a process flowchart, which depicts the activities of the process arranged in sequential order — this is business process management. ConceptDraw DIAGRAM is business process mapping software with impressive range of productivity features for business process management and classic project management. This business process management software is helpful for many purposes from different payment processes, or manufacturing processes to chemical processes. Business process mapping flowcharts helps clarify the actual workflow of different people engaged in the same process. This samples were made with ConceptDraw DIAGRAM — business process mapping software for flowcharting and used as classic visio alternative because its briefly named "visio for mac" and for windows, this sort of software named the business process management tools.
This flowchart diagram shows a process flow of project management. The diagram that is presented here depicts the project life cycle that is basic for the most of project management methods. Breaking a project into phases allows to track it in the proper manner. Through separation on phases, the total workflow of a project is divided into some foreseeable components, thus making it easier to follow the project status. A project life cycle commonly includes: initiation, definition, design, development and implementation phases. Distinguished method to show parallel and interdependent processes, as well as project life cycle relationships. A flowchart diagram is often used as visual guide to project. For instance, it used by marketing project management software for visualizing stages of marketing activities or as project management workflow tools. Created with ConceptDraw DIAGRAM — business process mapping software which is flowcharting visio alternative or shortly its visio for mac, this sort of software platform often named the business process management tools.
Picture: Process Flowchart: A Step-by-Step Comprehensive Guide
Related Solution:
Compare desktop flowchart software for Mac and Windows. Evaluate templates, symbol libraries, export formats, file control, and workflow fit for long-term documentation.
Picture: Professional Flowchart Software for Mac & Windows
Related Solution:
A database is a data collection, structured into some conceptual model. Two most common approaches of developing data models are UML diagrams and ER-model diagrams. There are several notations of entity-relationship diagram symbols and their meaning is slightly different. Crow’s Foot notation is quite descriptive and easy to understand, meanwhile, the Chen notation is great for conceptual modeling.
An entity relationship diagrams look very simple to a flowcharts. The main difference is the symbols provided by specific ERD notations. There are several models applied in entity-relationship diagrams: conceptual, logical and physical. Creating an entity relationship diagram requires using a specific notation. There are five main components of common ERD notations: Entities, Actions, Attributes, Cardinality and Connections. The two of notations most widely used for creating ERD are Chen notation and Crow foot notation. By the way, the Crow foot notation originates from the Chen notation - it is an adapted version of the Chen notation.
Picture: ERD Symbols and Meanings
Related Solution:
ConceptDraw DIAGRAM - workflow software extended with the Workflow Diagram solution provides a complete set of samples, templates and features help you to draw diagrams faster. A workflow software you use for drawing workflow diagrams and business process flow diagrams should provide a wide set of examples allows you get closer with workflow diagrams, learn symbols meaning, find appropriate layout and design, and then start drawing your own workflow diagram masterfully. Workflow diagrams used for orchestrating organizational processes between company departments and humans, so critical process diagrams used to train many people to interact must be clear and professional to convey an idea from a view. Thats a reason we created a lot workflow symbols and workflow icons collected them into special Workflow Diagram solution in ConceptDraw Solution Park.
Picture: Workflow Diagram Examples
Related Solution:
If you are just a beginner in drawing flowcharts, it may seem that a sheet of paper and a pen are just enough. However, at the time you would want to share your results, diagramming applications would suite you better. it’s very easy to create diagrams that way and to discover new kinds of flowcharts.
The huge collection of sample ConceptDraw diagrams, charts, illustrations and other types of business drawings includes a wide range of business themes. A huge number of graphic images of ConceptDraw documents is divides on business application areas according to business-oriented solutions for which they were made.Here is a short visual list of samples of flowcharts, process diagrams, UML models, management charts, computer network diagrams, maps, infographics, illustrations, etc. In short, each ConceptDraw solution is accompanied with at least ten samples representing some particular examples of the application of the given chart.
Picture: Applications
When thinking about data visualization, one of the first tools that comes to mind is a flowchart design. You can find flowchart symbols, shapes, stencils and icons easily on the Internet, but it might take time to systematize this information. Nevertheless, once you start flowcharting, you’ll love its simplicity and efficiency.
This diagram consists from standard flowchart symbols, approved by ANSI (American National Standard Institute) for drawing flowcharts. A flowchart is a diagram that represents a step-by-step algorithm of any process, displaying the process stages as boxes that are connected with arrows. Flowchart design makes it clear and readable.
Flowchart designed using ConceptDraw DIAGRAM flowchart software allows to make attractive and clear process presentation, it makes interpretation of the business process flow fresh and versatile. Great flowchart design view is a big advantage over the diagram created manually on a paper.
Picture:
Flowchart Design
Flowchart Symbols, Shapes, Stencils and Icons
Related Solution:
It can be tough to get straight into business papers and processes.Otherwise, you can learn how to create flowcharts for an accounting information system and visualize these documents. Accounting diagrams are clear and easy to understand for all the participants of the process.
There are symbols used for creating accounting flowcharts using ConceptDraw DIAGRAM and its Accounting Flowcharts solution. Accounting flow charts are a special kind of flow charts. Actually a variety of flowcharts are often used to facilitate many aspects of a workflow of accounting department. Accounting flowcharts are utilized to support creating accounting documentation, to depict positions responsible for fulfillment of each phase of accounting workflow.
Picture:
How to Create Flowcharts for an
Accounting Information System
Related Solution:
A flowchart is a powerful tool for examining processes. It helps improving processes a lot, as it becomes much easier to communicate between involved people, to identify potential problems and to optimize workflow. There are flowcharts of different shapes, sizes and types of flowchart vary from quite basic process flowcharts to complex program flowcharts. Nevertheless, all these diagrams use the same set of special symbols like arrows to connect blocks, parallelogram to show data receiving or rectangles for showing process steps.
Basic flowcharts are used to represent a simple process algorithm. A basic flowchart notation consists of rectangles (business processes), arrows (the flow of information, documents, etc.). The same notation is used in items such as the "decision", which allow you to do the branching. To indicate the start of the entire business process and its termination can be used the "Terminator" element. The advantages of Basic Flowchart are simplicity and clarity. With it you can quickly describe the business process steps. Creating of Basic Flowchart does not require any special knowledge, as easily understand by employees with different levels of education and IQ.
Picture: Types of Flowchart: Comprehensive Overview
Related Solution:
There are many ways to track the system in a critical situation. To model a system behavior, uml notation is widely used. Usually, an UML diagram consists of elements such as actor and a case.
This diagram represents the structure of UML notations. Unified Modeling Language (UML) is used in software engineering to depict graphically the software modeling process. UM Language uses graphic notations for developing models of object-oriented systems. These notations displays requirements, sub-systems, logical and physical elements, etc. We created this diagram using ConceptDraw DIAGRAM reinforced with Rapid UML solution. It can be helpful for students on software engineering, when learning UML.
Picture: UML Notation
Related Solution:
Local area network connects computers and other network appliances within an area, such as office building or a campus. It can be difficult to provide such network without a predesigned plan. For these purposes you can use network diagram software, which helps you to create LAN network diagrams and office network diagrams quickly and effortless. This will speed up your work and you can save the diagram for the future network improvements.
The following diagram illustrates a network topology of the small office. LAN configuration has a star topology. The local network joins 8 computers among which are several desktop PCs, laptop, two iMacs and iBook. The end-point devices are divided into three groups. Each group is connected to its hub. There is a network printer and a modem, which are interconnected with other devices through a network server. Each computer on the LAN can access the server through a corresponding hub.
Picture: Network Diagram Software. LAN Network Diagrams. Physical Office Network Diagrams
Related Solution: