Made with
ConceptDraw
DIAGRAM 18

Allergy Testing

Allergy testing is the first step to effective allergy treatment. It includes a range of different methods for medical diagnosis of allergy and recognizing the types of allergens causing it. Allergy testing is provided by skin tests and blood tests.

Both adults and children are tested for allergies, the way of testing is chosen individually according to age and other factors. Each of the tests has its own pros and cons. Skin tests cost less and give results faster than blood allergy tests. But they require good training from the medical worker and some medicines can interfere with the test correctness. Blood tests are more expensive and getting results takes a long time.

In any way, allergy testing is a provocation of a small, controlled, allergic response. However, to make a correct diagnosis and prescribe treatment, a single test is not enough, it is also necessary to take into account the complete medical history of the patient.

As for the skin tests, a microscopic amount of an allergen is introduced to a patient's skin. It is realized in different ways: by under-dermis injection with a hypodermic syringe (intradermic test) or by applying a patch with the allergen (patch test). The different allergens are applied on a large patch, it is put on the skin, commonly on the back.

It is also applied the pricking of skin with a needle or pin with the allergen (skin prick test), a deep scratch by the blunt bottom of a lancet (skin scratch test), or a superficial scrape by the bevel of a needle (skin scrape test). The skin scrape test is the most used, it is painless because impacts just on the superficial layer of the skin. The result is taken in a period from a few minutes to several days. An immuno-response appearing in the form of rash or hives indicates a hypersensitivity to a certain allergen. A negative test does not completely exclude an allergy, the insufficient concentration of introduced allergen can be the reason.
Allergy Testing

Example 1. Allergy Testing

One more intradermal test is the skin endpoint titration (SET). The intradermal injections of allergens are started with minimal concentrations and gradually are increased. In 10 minutes after injection, the site is explored on the response. If the growth of wheal and swelling of the skin is fixed, the second injection at a higher concentration is given to confirm the response.

Blood tests measure the presence of IgE antibodies to specific allergens in a patient's blood. There are two types of allergy blood tests: a total IgE test measuring the overall number of IgE antibodies in your blood and a specific IgE test identifying the level of IgE antibodies in response to specific allergens. The increased IgE level in a total IgE test means a patient has some kind of allergy and only a specific IgE test identifies the particular allergens.
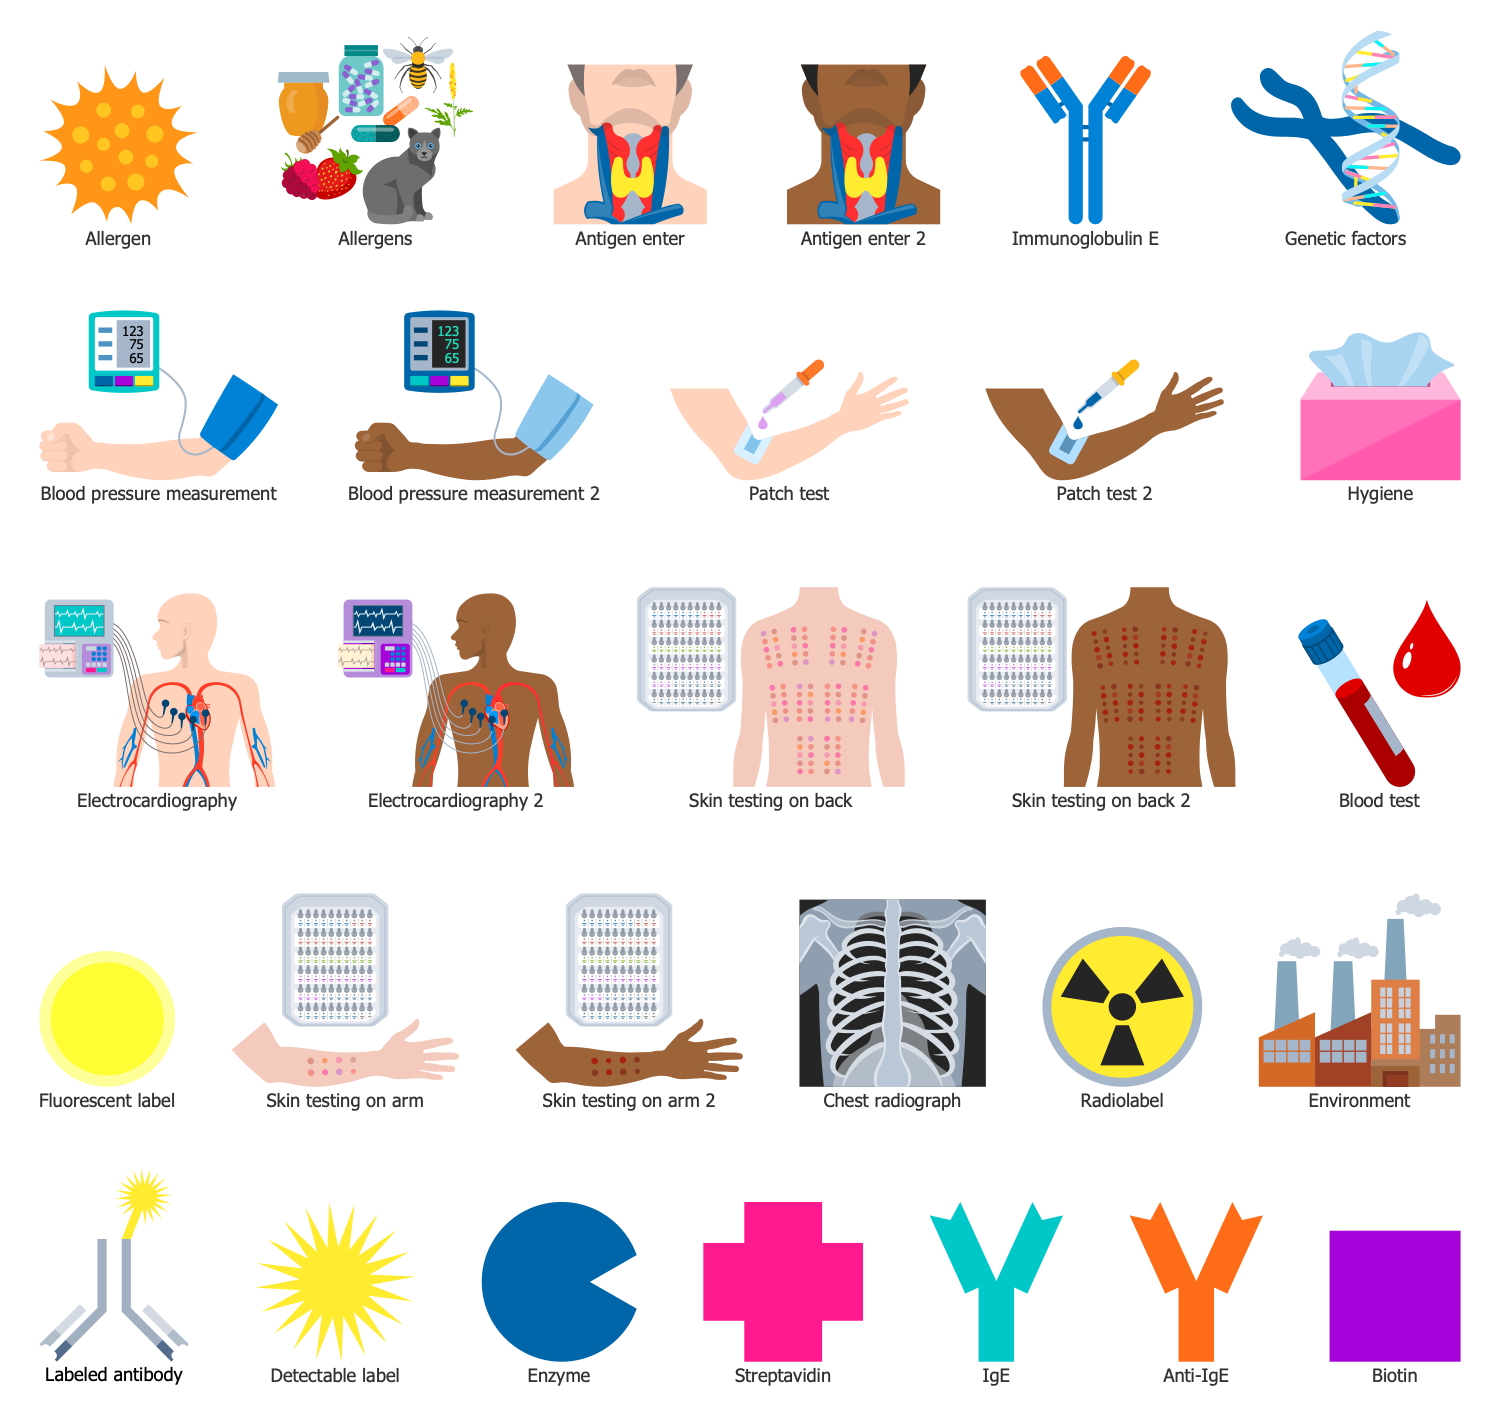
Allergy Diagnostics Library Design Elements

Example 2. Allergy Diagnostics Library Design Elements

While the skin tests give an immediate result, at least several days are needed to receive the results of an allergy blood test. At the same time, blood tests are not affected by taking antihistamines and suit for people with extensive rashes.

However, all types of allergy tests have accuracy. About 50-60 percent of all allergy tests are false positive, this means you take a positive result when you haven't an allergy to a specific allergen. This can occur for different reasons, the test can react for the products from a similar group or react to the undigested food proteins. The additional tests are made, if necessary.

The modern ConceptDraw DIAGRAM software extended with Allergology solution is helpful in designing attractive allergology illustrations, infographics, diagrams, schematics. Use it to depict in minutes the allergy testing ways, the common triggers, common symptoms, diagnostic ways, and allergy treatment methods.
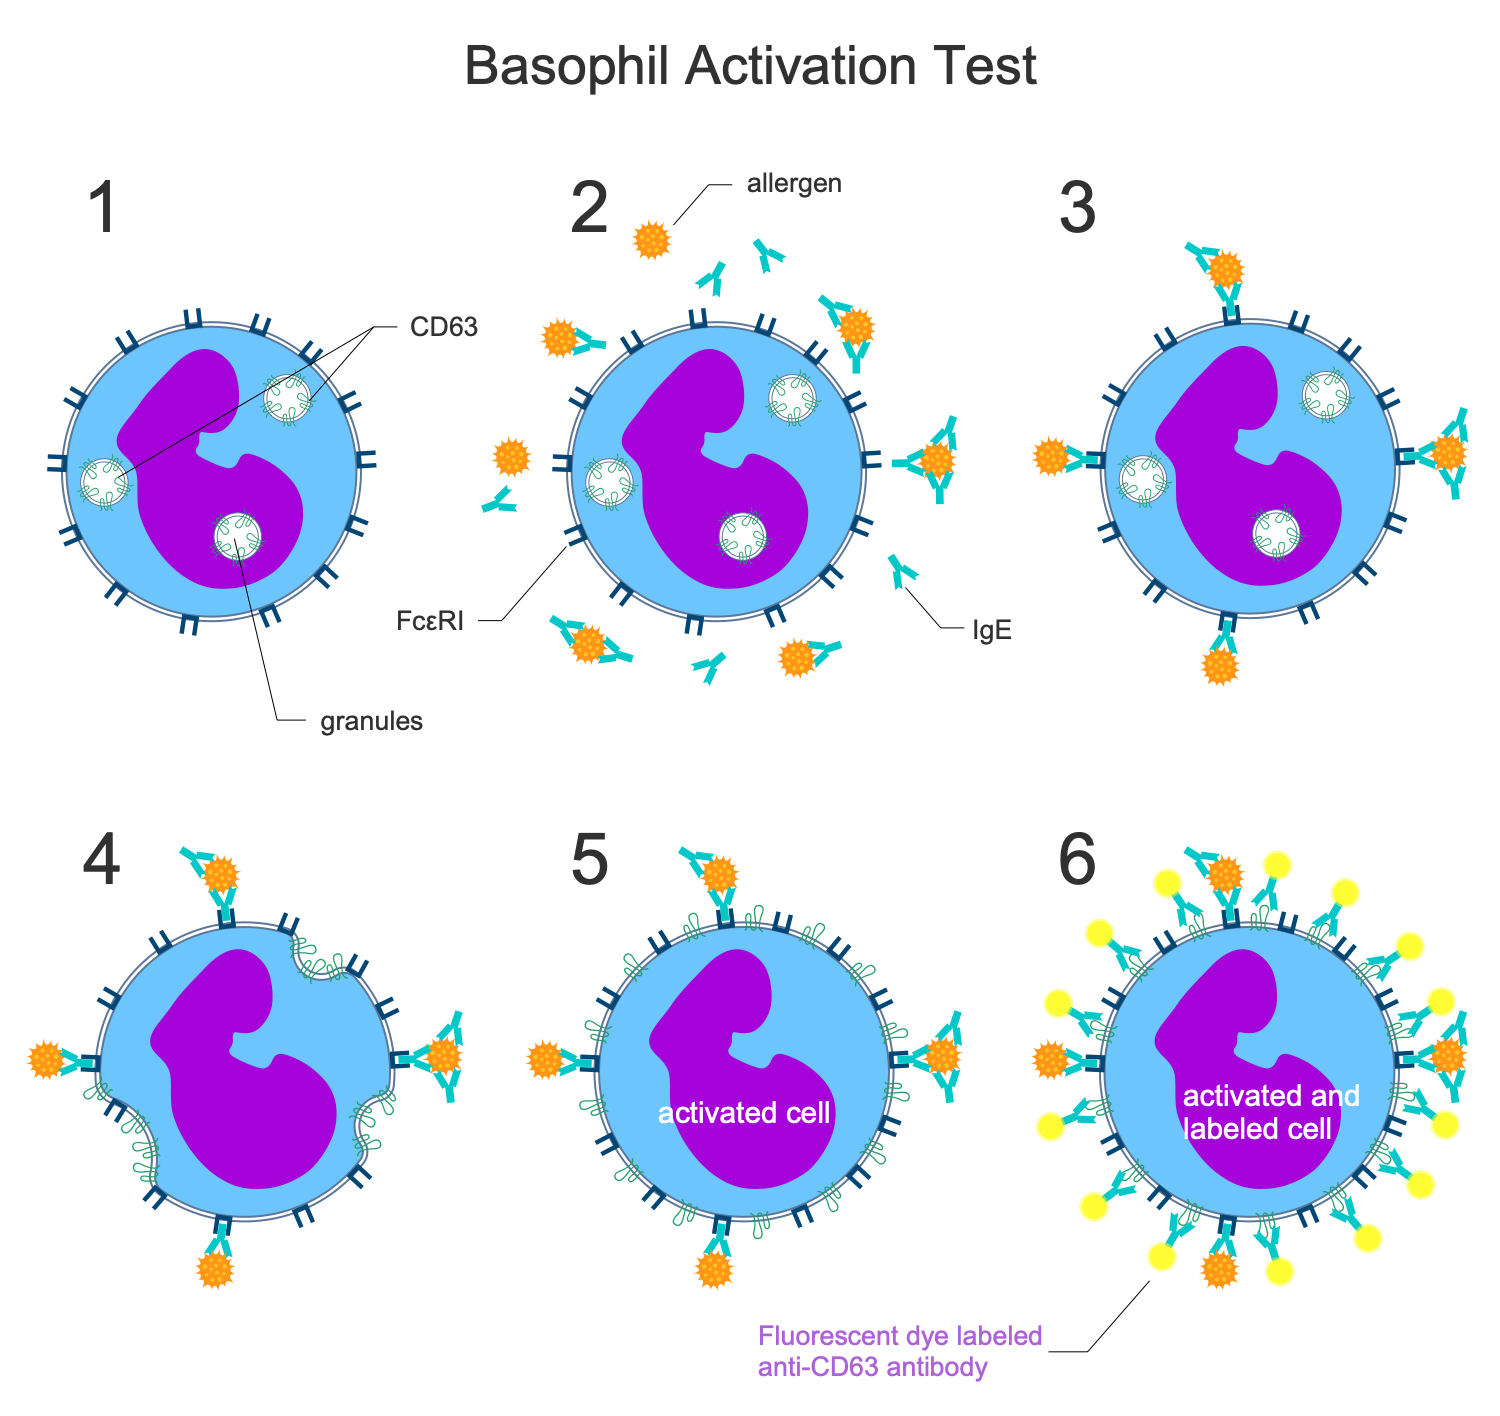
Basophil Activation Test

Example 3. Basophil Activation Test

The useful drawing tools of the Allergology solution include a large set of ready-made samples and examples and a collection of predesigned vector design icons and pictograms used in the allergology area. They are grouped in 11 libraries:

  • Allergic Diseases library
  • Allergy Symptoms library
  • Allergy Diagnostics library
  • Allergy Treatment library
  • Allergy Pathophysiology library
  • Allergy People library
  • Allergy Diet library
  • Anaphylaxis Emergency library
  • Asthma Triggers library
  • Food Allergens library
  • Non-Food Allergens library

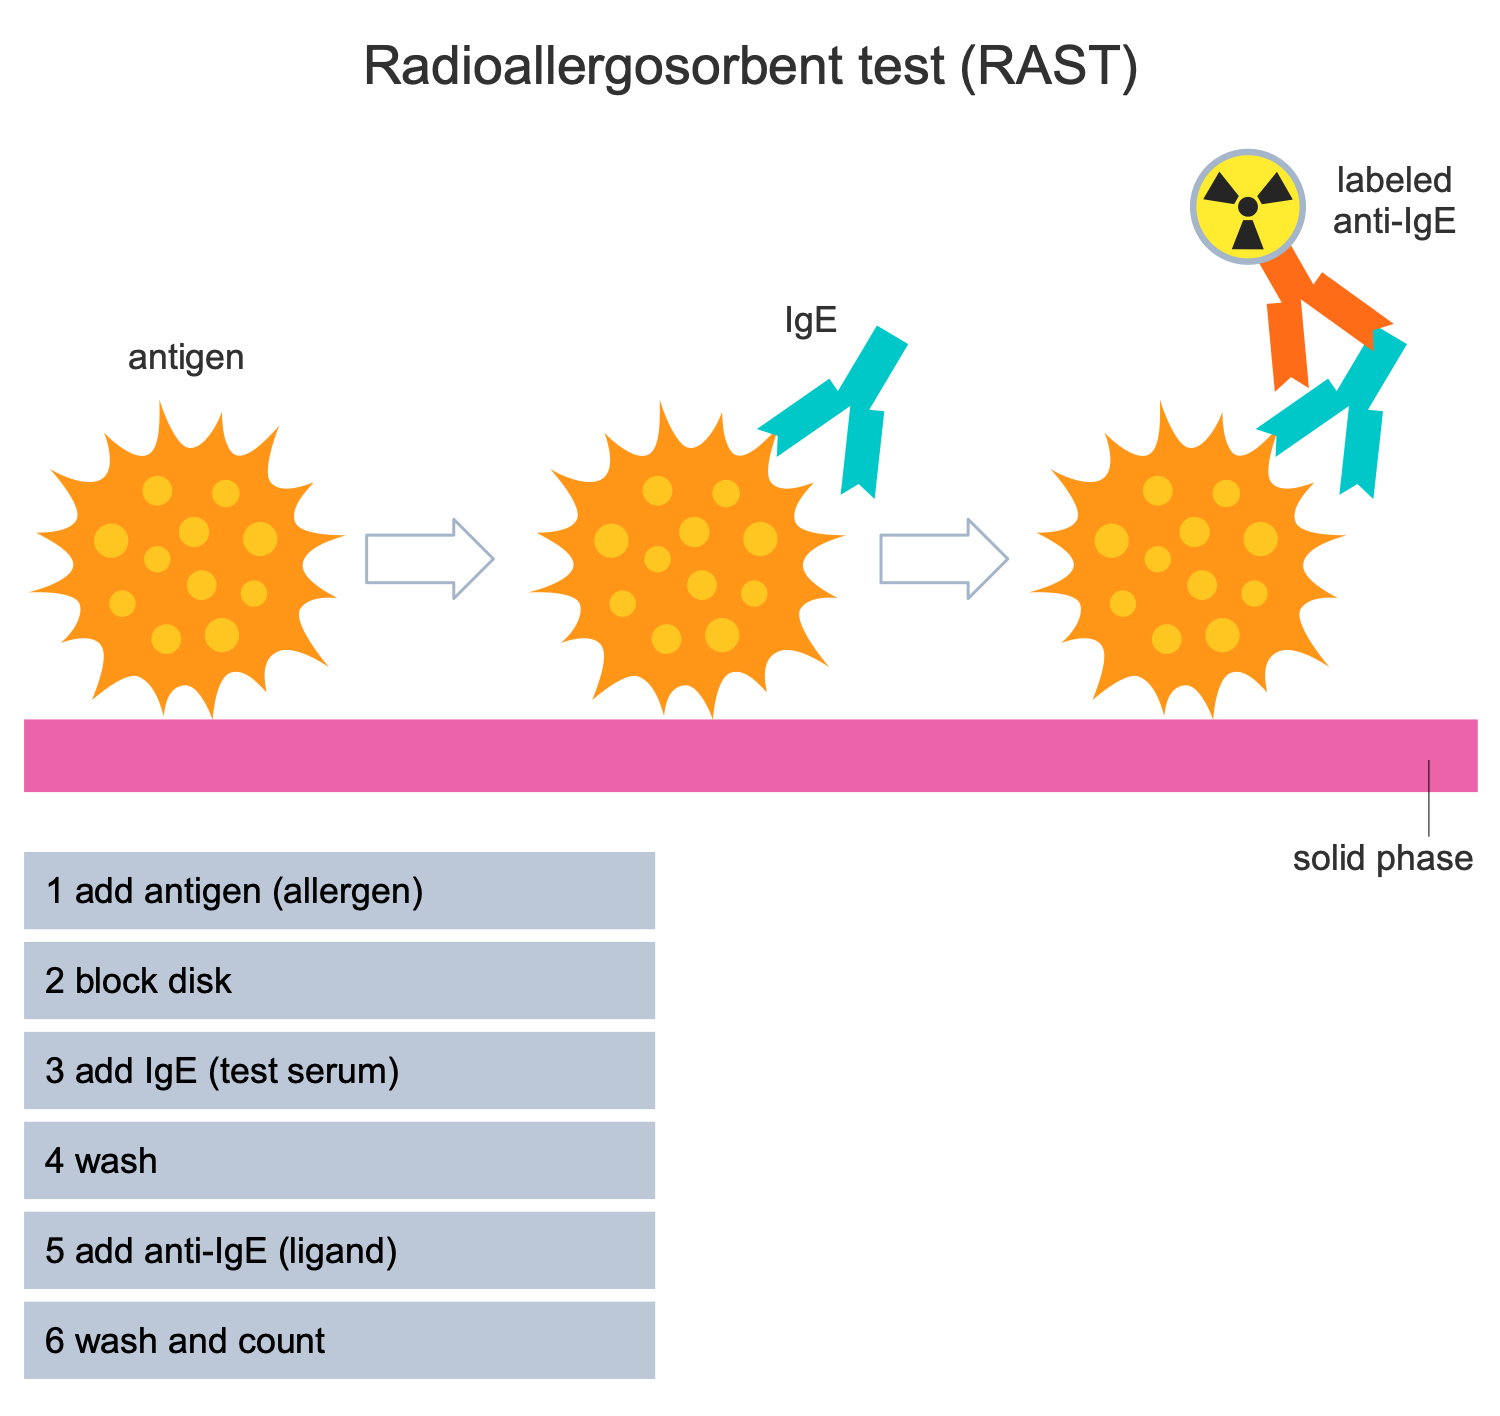
The included objects allow easy making an overview of allergology skin and blood tests, including RAST test, SET test, and others. The included samples are a perfect base for each ConceptDraw DIAGRAM user for designing faster based on them.

Asthma Attack

Example 4. Asthma Attack

The allergy testing infographics you see on this page were created in ConceptDraw DIAGRAM software using the Allergology Solution. They successfully demonstrate the solution's capabilities and professional results you can achieve. An experienced user spent 15-20 minutes creating each of these samples.

Use the powerful tools of the Allergology Solution for ConceptDraw DIAGRAM software to create your own infographics and diagrams of any complexity fast and easy, and then successfully use them in your work activity.

All source documents are vector graphic documents. They are available for reviewing, modifying, or converting to a variety of formats (PDF file, MS PowerPoint, MS Visio, and many more graphic formats) from the ConceptDraw STORE. The Allergology Solution is available for all ConceptDraw DIAGRAM users.
TEN RELATED HOW TO's:
Accounting is a cornerstone of any business, it’s basement. If you want to have a visual representation of your finance management, use audit flowchart symbols to document the money flow. Although some would say that accounting is boring, it is very a responsible duty. The audit flowchart symbols is supplied with ConceptDraw Audit Flowcharts solution as a vector objects library. Together with Conceptdraw Drawing capabilities it forms the helpful tool for audit process planning and setting the steps of audit by designing audit flow charts. Audit Flow charts are used to organize fiscal information tracking process as well as in accounting, finance and investment management.Audit Flowchart Symbols
Picture: Audit Flowchart Symbols
Related Solution:
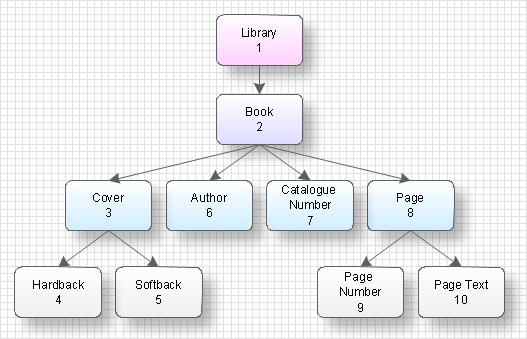
Data structure diagram (DSD) is intended for description of conceptual models of data (concepts and connections between them) in the graphic format for more obviousness. Data structure diagram includes entities description, connections between them and obligatory conditions and requirements which connect them. Create Data structure diagram with ConceptDraw DIAGRAM.Data structure diagram with ConceptDraw DIAGRAM
Picture: Data structure diagram with ConceptDraw DIAGRAM
Diagramming is an astonishing way to visualize business processes. The list of the most common business process flowchart symbols is quite long starting from basic flowcharts, continuing with SIPOC diagrams. Business process modeling was never easier than now, with special ConceptDraw Business Process Mapping solution. To carry out all professional standard requirements for business processes mapping, it is necessarily to follow the special graphical notations. ConceptDraw Business Process Mapping solution offers an exhaustive suite of tools to aid business process mapping. There are three vector libraries SIPOC Diagrams, Business Process Flowcharts, and Swim Lanes that contains totally more than 50 symbols of standard BPM notations. This is all that professionals need to effectively evaluate and manage quality in business processes.Business Process Flowchart Symbols *
Picture: Business Process Flowchart Symbols
Related Solution:
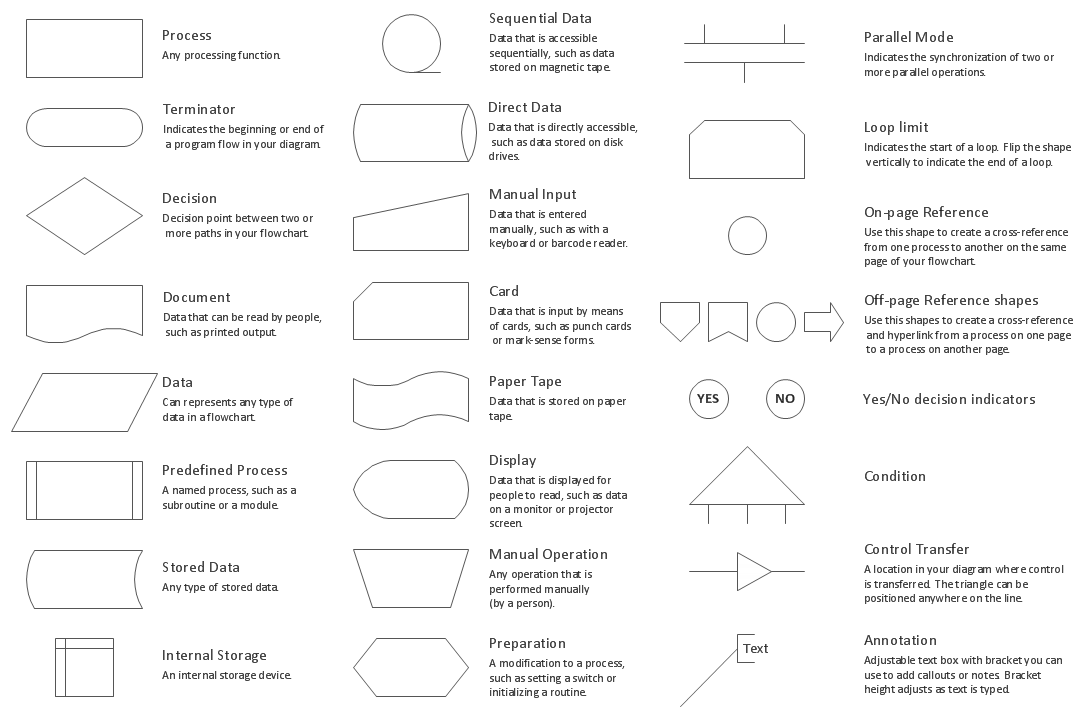
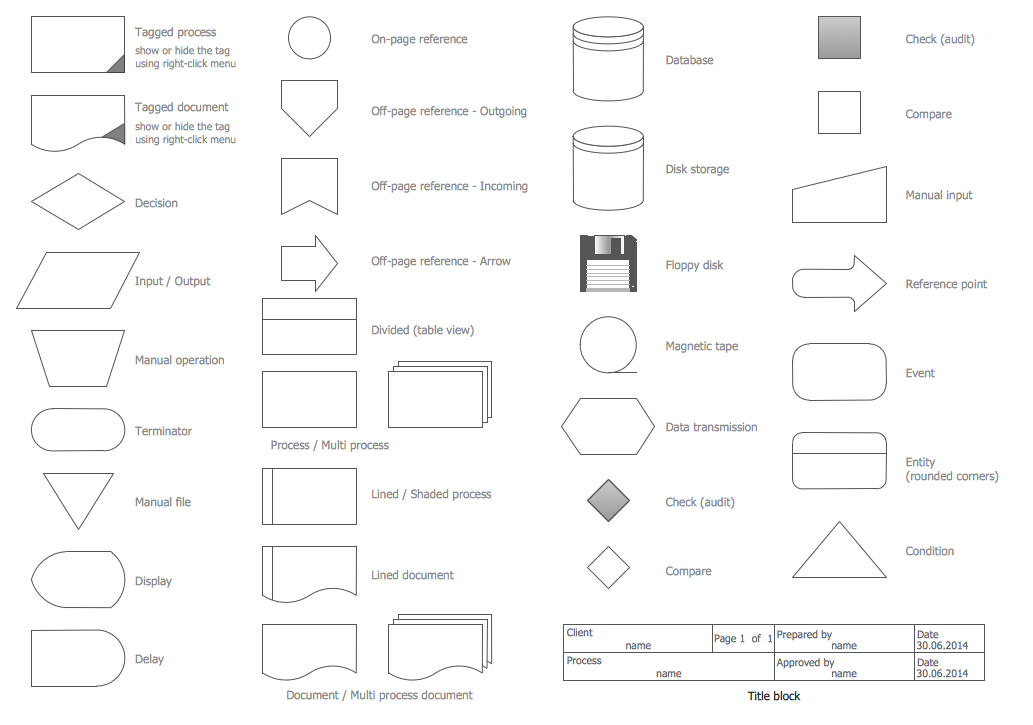
If you need to describe some process, diagramming is a perfect tool for almost any imaginable purpose. The set of the most commonly used flow charts symbols is quite wide and includes symbols for operations, processes, data inputs and outputs. You can see the full list of all the symbols used for flowcharting in Flowcharts solution from Diagrams area in ConceptDraw Solution Park. A flow chart is often used for visual representation of a sequential process flow. The flowchart approach to any process is to divide it into some sequential actions. What makes a flow chart so popular and clear to make out is the set of standard flowchart symbols that has the same reading independently from processes described with their applying. The current drawing represents the vector library containing the pack of standard flowchart symbols. This library is supplied with ConceptDraw Flowcharts solution.Flow Chart Symbols
Picture: Flow Chart Symbols
Related Solution:
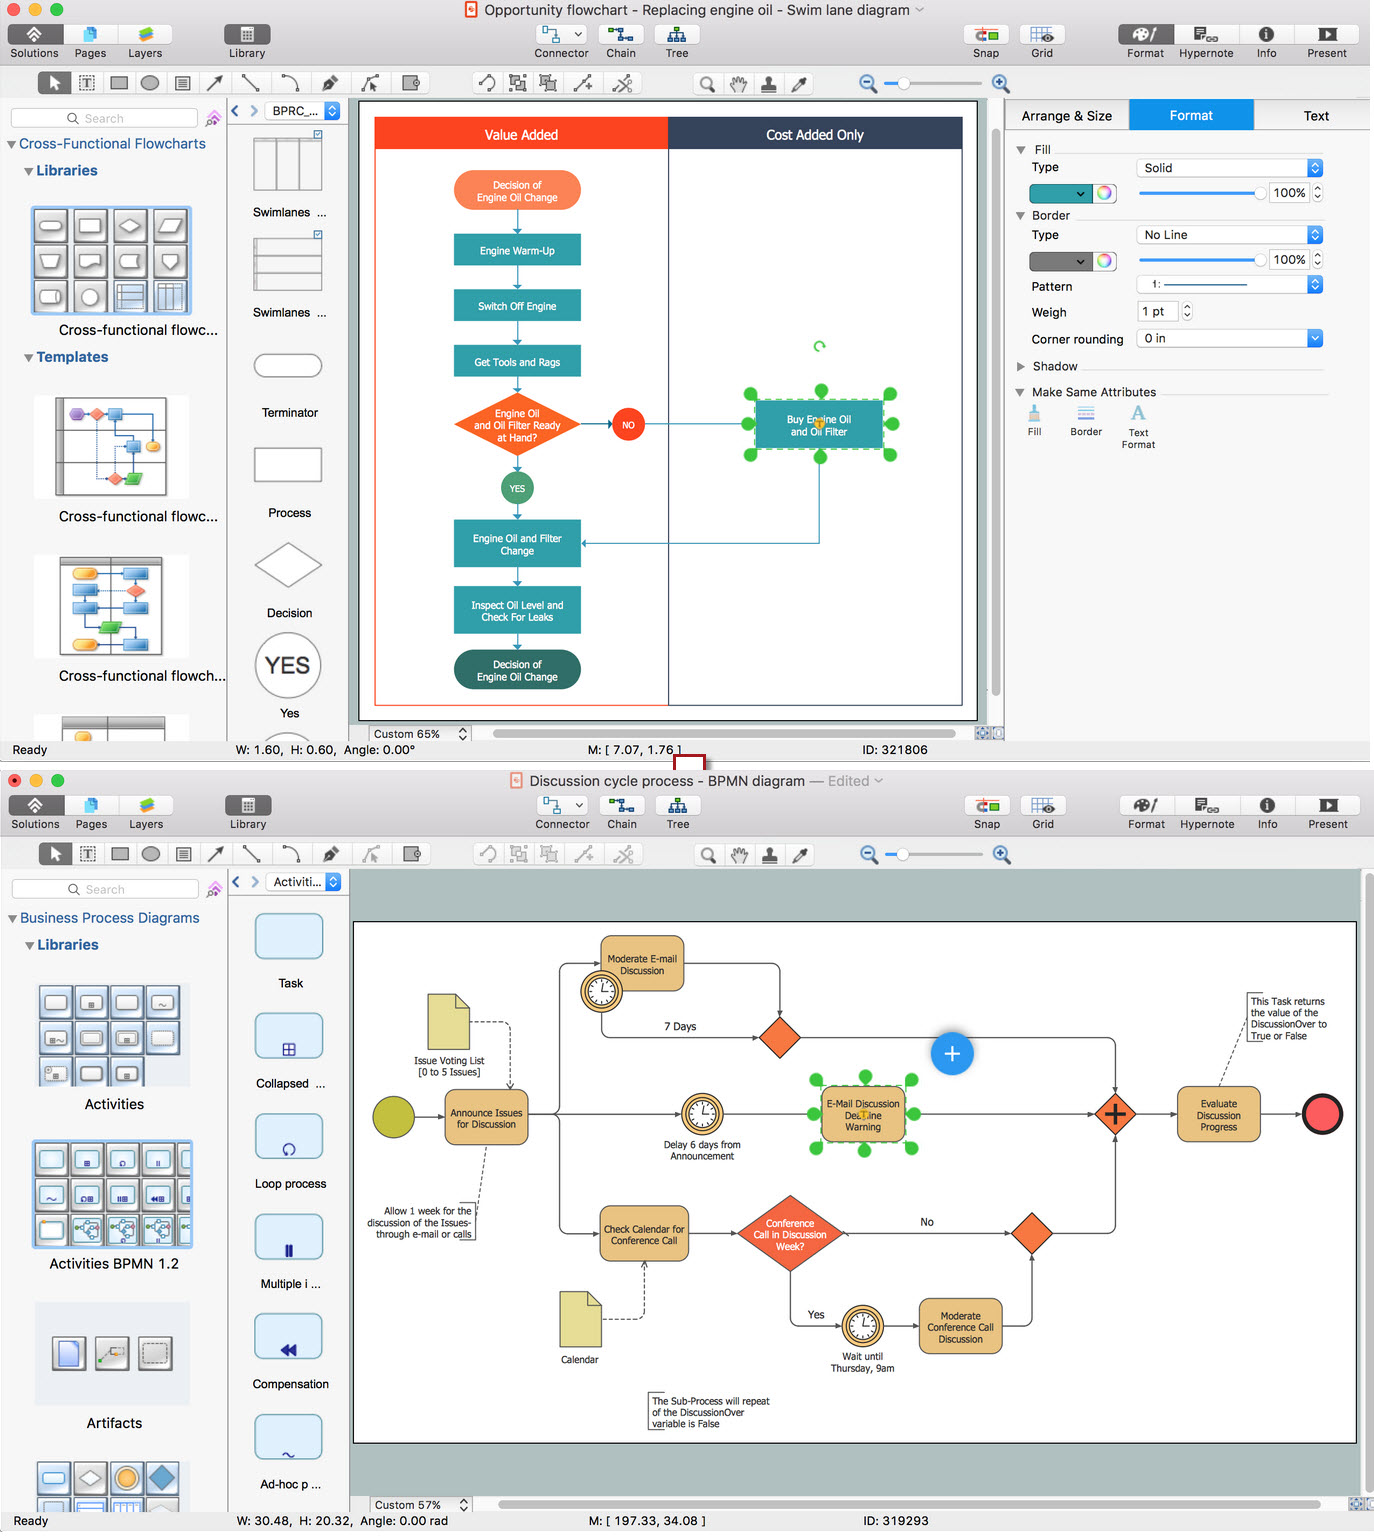
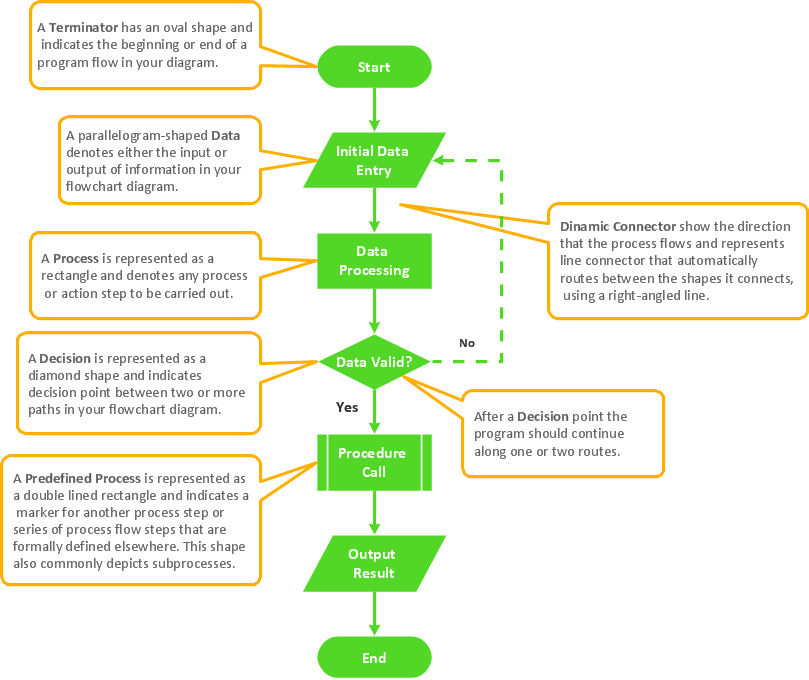
A flowchart is a simple but very functional tool when it comes to understanding a workflow or to removing unnecessary stages from a process. When drawing flowcharts, keep in mind that there are four common types of flowcharts, like document flowcharts and data flowcharts that show control over a data or document flow over a system. To show controls on a physical level, use system flowcharts. In addition, to show controls in a program, you can draw a program flowchart. This flowchart diagram represents the piece of an article editing process, that involves the author and editor. It was created using the Basic Flowchart notation that consists from the basic flowchart symbols. The start and the end of the process are indicated with "Terminator" symbols. The "Process" symbols show the action steps consisting from making edits and searching for a compromise, when the author does not agree with the suggestions of the editor. The "Process" symbol is the general symbol in process flowcharts. The "Decision" symbol indicates a branching in the process flow. There are two branches indicated by a Decision shape in the current flowchart (Yes/No, Disagree/Agree). This basic flowchart can be used as a repeating unit in the workflow diagram describing the working process of some editorial office.Types of Flowcharts *
Picture: Types of Flowcharts
Related Solution:
Use ConceptDraw DIAGRAM diagramming and business graphics software to draw your own flowcharts of computer algorithms.Process Flow app for macOS *
Picture: Process Flow app for macOS
Related Solution:
The ConceptDraw Flowchart component includes a set of samples and templates. This geathered as flowchart maker toolbox which focused on drawing flowcharts of any industry standards.Flowchart Components
Picture: Flowchart Components
Related Solution:
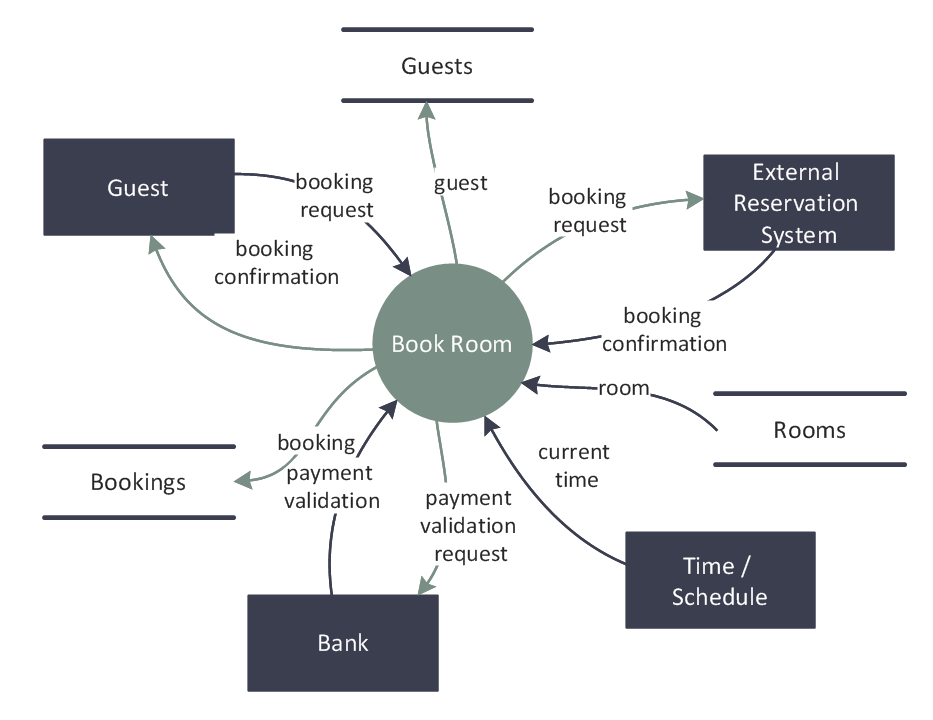
Data flow diagrams are the graphical tool, used in the visualization of data flow of some data processing systems. It is the valuable process modeling tool. Also designing DFD is the important component of the initial part of any information system development project. The standard symbols are used to represent the interaction of a system components and how various kinds of components influence on data flow. The ConceptDraw Data Flow Diagrams solution is design to assist professional software engineers in making DFDs according to Gane and Sarson, and Yourdon and Coad notations. Do you imagine yourself as a successful IT specialist? To your mind, they all use data flow diagram examples to learn and to get inspired. Aren’t you still with us?Data Flow Diagram Examples *
Picture: Data Flow Diagram Examples
Related Solution:
ConceptDraw DIAGRAM is a world-class diagramming platform that lets you display, communicate, and present dynamically. It′s powerful enough to draw everything from basic flowcharts to complex engineering schematics. Video tutorials on ConceptDraw products. Try it today!Business  Process Mapping — How to Map a Work Process *
Picture: Business Process Mapping — How to Map a Work Process
Related Solutions:
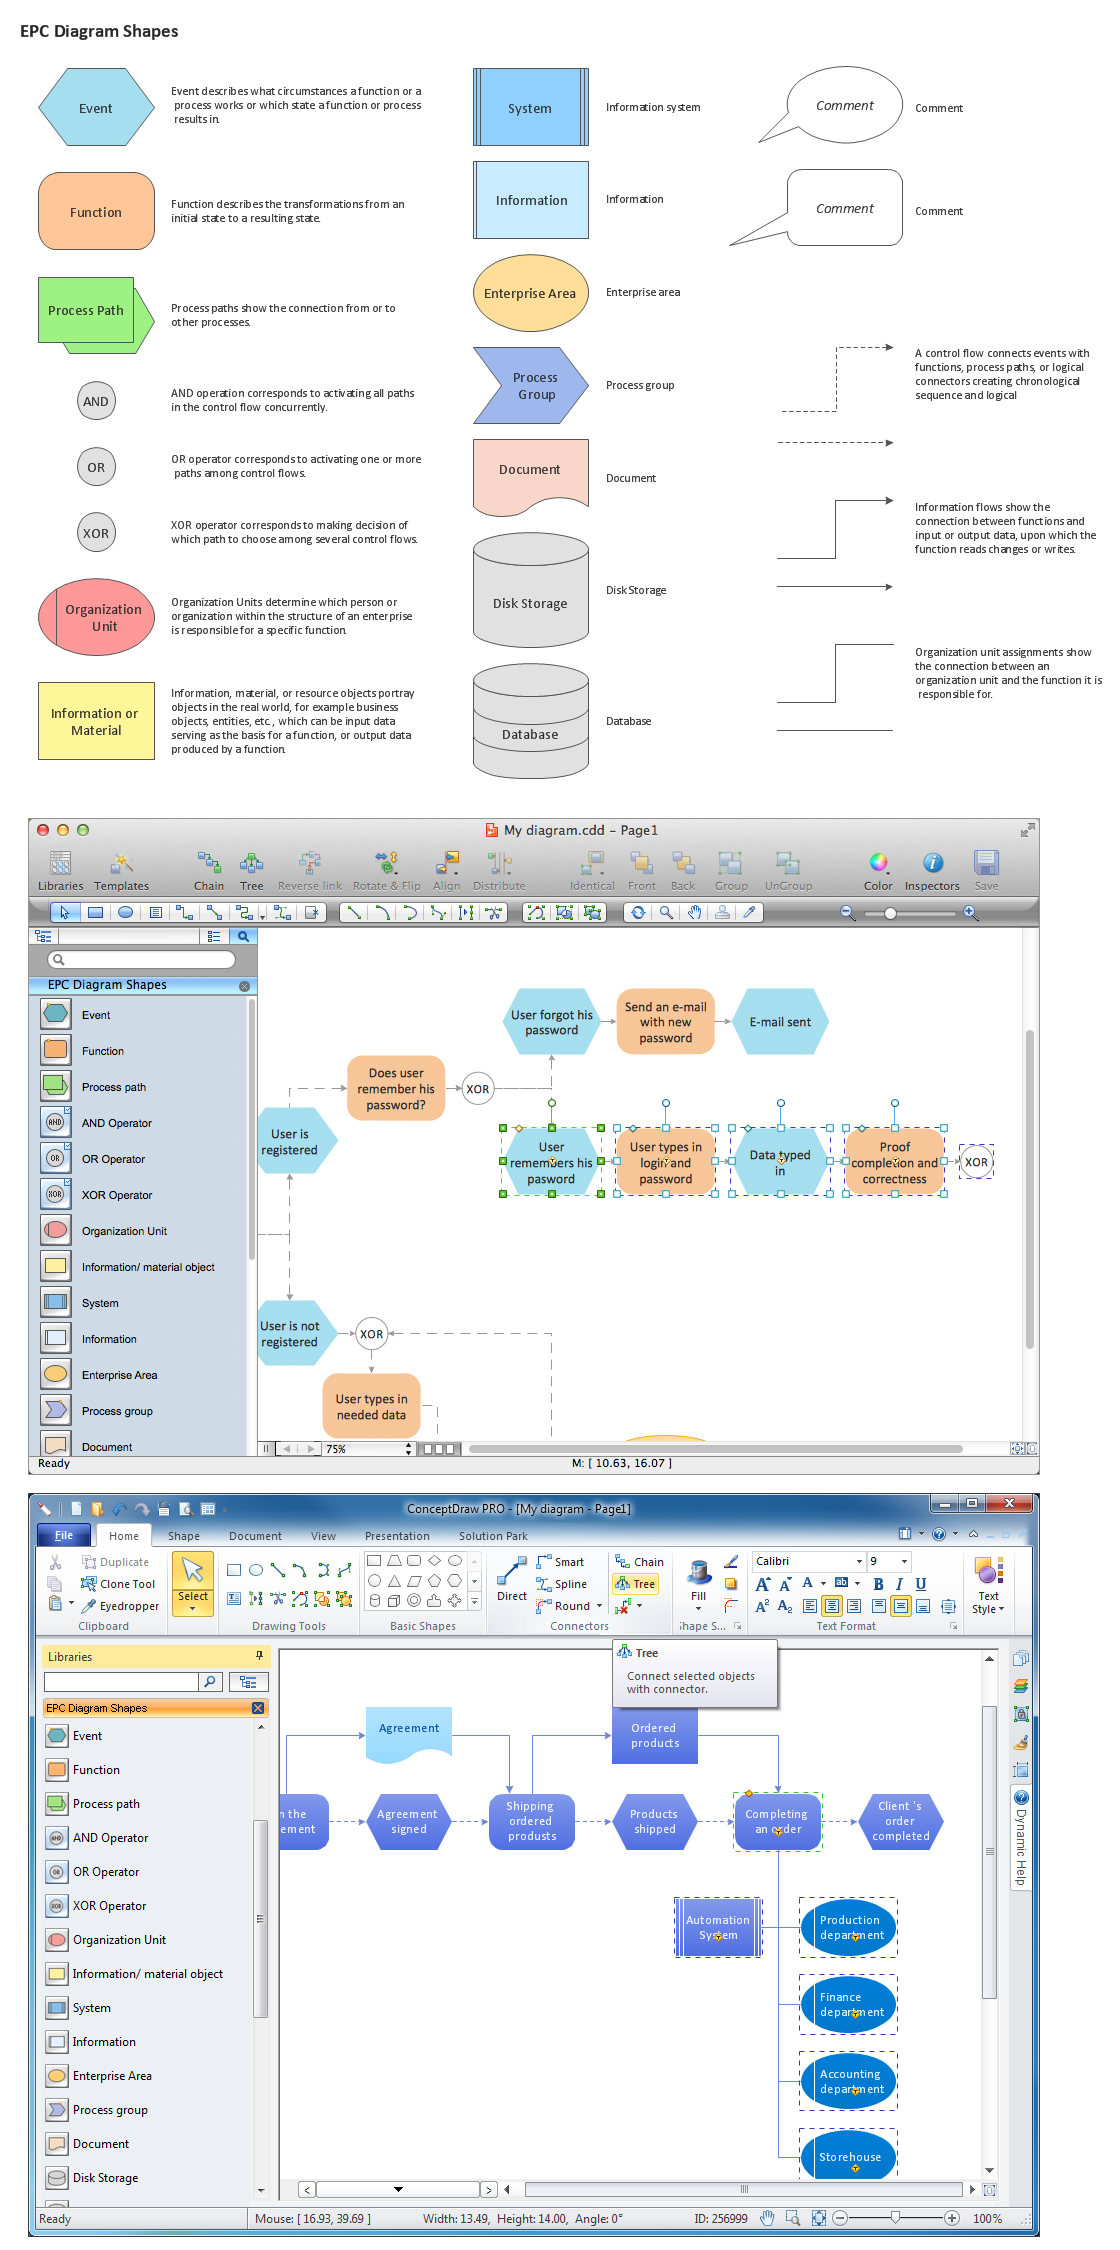
Event-Driven Process Chain Diagrams for improvement throughout an organisation. ConceptDraw DIAGRAM - software that reduces the time needed to create a business process model.Graphical Symbols to use in EPC diagrams *
Picture: Graphical Symbols to use in EPC diagrams
Related Solution:
ConceptDraw
DIAGRAM 18