Made with
ConceptDraw
DIAGRAM 18

Allergology

Allergology is the branch of medicine studying allergies and hypersensitivity of the immune system. It studies the etiology, pathogenesis, reactions, clinical manifestations of allergies, their causes of occurrence. It develops ways of diagnosis, classification, prevention, and treatment the allergic diseases.

Allergology science is closely related to immunology because allergy is an abnormal and specific reaction caused by a disorder of the immune system. It entails the excessive immune response and production of histamines against substances not harmful to most people but causing increased sensitivity in a certain person. They are allergens for him and trigger the body's immunological mechanisms.

Allergological researches are actively conducted since the beginning of the 20th century. The French physiologists C. Richet, M. Arthus and the Russian scientists V. I. Molchanov, P. S. Medovnikov studied the anaphylactic reactions. In 1905 the Russian scientist G. P. Sakharov discovered serum anaphylaxis in guinea pigs. In 1906 the Austrian doctor C. Pirquet introduced the concept of allergy. Later, A. M. Bezredka introduced the concept of anaphylactic shock. At that time the group of illnesses called “allergic” was designated. It includes bronchial asthma, allergic conjunctivitis, sympathetic ophthalmia, allergic rhinitides, sinusitis, laryngitis, dermatoses, and a number of others.

In modern society, allergic reactions and diseases are widespread. In this regard, allergology is a relevant area of science and its development is incredibly important. The increase in the allergies prevalence is associated with the deterioration of the environment, quality of food, and increase in production and use of chemicals.

Allergology Infographics Design in ConceptDraw DIAGRAM

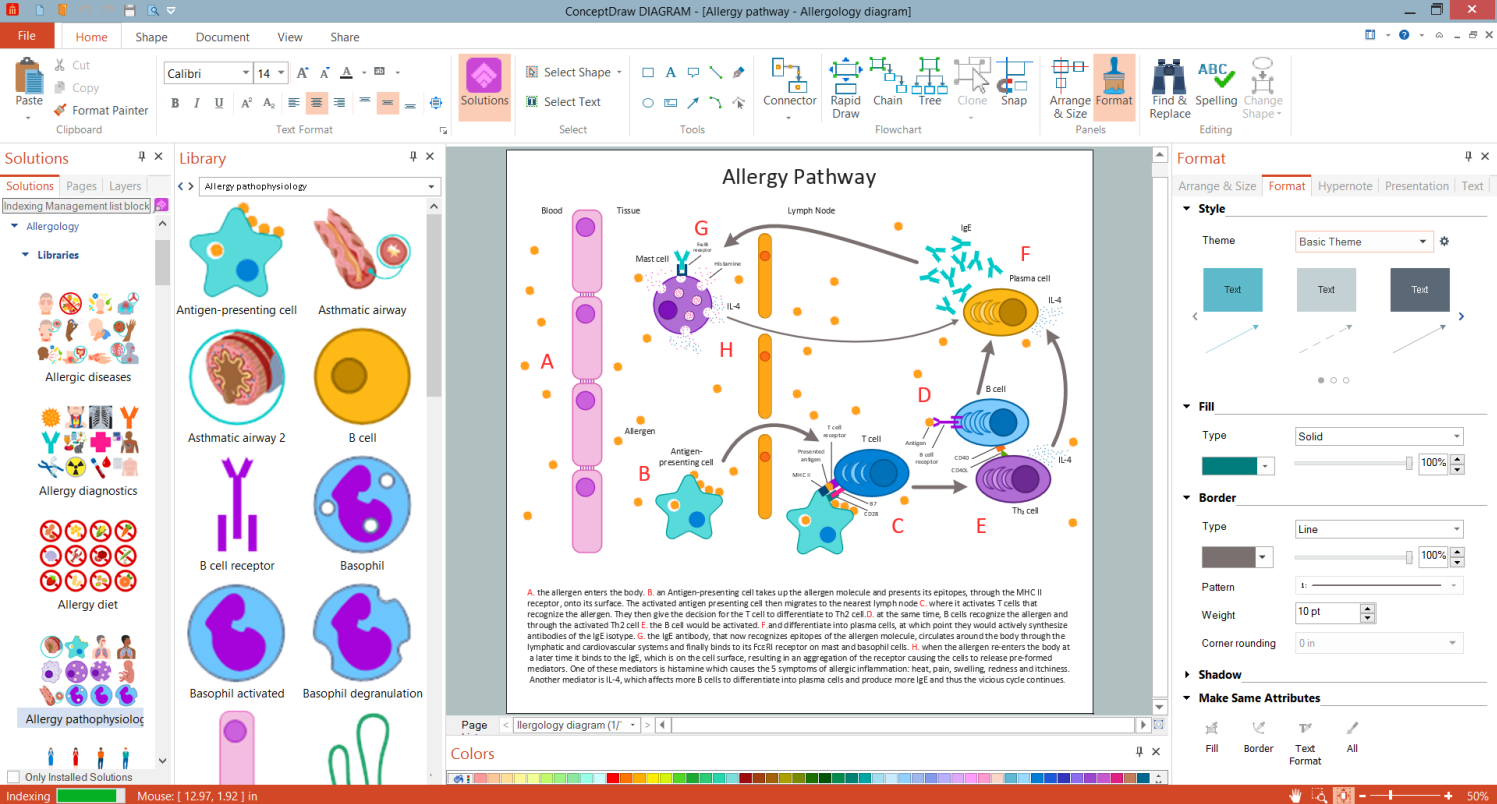
Example 1. Allergology Infographics Design in ConceptDraw DIAGRAM

Among the manifestations of allergic reactions, there are runny nose, face swelling, redness of eyes and skin, rashes, itchiness, hives, lacrimation, drop in blood pressure, and sharp suffocation in severe cases. The most common are:

  • allergic rhinitis occurring in 20% of residents of developed countries;
  • food allergies present in 6% of people;
  • atopic dermatitis;
  • bronchial asthma, the prevalence in different countries is from 1% to 18%;
  • anaphylactic shock is the most severe type of allergic reactions found in 0.5-2% of people.

Allergology uses a set of methods to diagnose allergies, including special skin tests and blood tests for the content of specific antibodies. During the study using a skin test, the suspected allergens are introduced into the patient's skin and response is determined. The skin's reaction in the form of redness or a blister confirms the allergy to a specific allergen. The test for specific antibodies called immunoglobulins E (IgE) involves the detection of high levels of immunoglobulins in the blood serum against a certain antigen. It indicates an allergy to the corresponding allergen.

Among the main methods of opposing allergies the prevention of contact with specific allergens is in the first place. Anti-allergic medications are also widely used, they block the inflammatory process and eliminate the allergy symptoms. Immunotherapy is used for the treatment of allergies. These are the vaccinations with allergens starting with a small dose and gradually increasing it. The second type of immunotherapy is the injection of antibodies directed against immunoglobulin E. These antibodies attach to the immunoglobulin and it cannot bind to the allergen.

Asthma Attack Infographics in ConceptDraw DIAGRAM

Example 2. Asthma Attack Infographics in ConceptDraw DIAGRAM

ConceptDraw DIAGRAM software enhanced with the powerful drawing tools of the Allergology solution allows easy designing attractive, visual, colorful, and high-quality allergology infographics, diagrams, illustrations. They are perfect for further use in presentations, official documents, reports, medical journals, review articles, posters, educational materials, and other materials.

Allergology solution is a tool allowing you simple designing of professional-looking allergology diagrams and infographics regardless of your level in fine art. It offers a lot of powerful drawing tools, they greatly easier your designing work. Among large variety of included samples, examples and ready-made vector design elements of allergology-related icons you will definitely find the suited ones. You can choose among Design Elements — Food Allergens, non-food allergens, allergy symptoms, treatment, diagnostics, and many more icons.

Anti Allergy Immunotherapy

Example 3. Anti Allergy Immunotherapy

Illustrate the allergology problems and ways to avoid or cope the allergy. Enlighten audience for the allergy causes and common symptoms, danger of anaphylaxis, its signs and offer tips of first aid. Design your infographics from a blank sheet or based on the included samples.

Tissues Affected in Allergic Inflammation

Example 4. Tissues Affected in Allergic Inflammation

The allergology infographics you see on this page were created in ConceptDraw DIAGRAM software using the Allergology Solution. They successfully demonstrate the solution's capabilities and professional results you can achieve. An experienced user spent 15-20 minutes creating each of these samples.

Use the powerful tools of the Allergology Solution for ConceptDraw DIAGRAM software to create your own infographics and diagrams of any complexity fast and easy, and then successfully use them in your work activity.

All source documents are vector graphic documents. They are available for reviewing, modifying, or converting to a variety of formats (PDF file, MS PowerPoint, MS Visio, and many more graphic formats) from the ConceptDraw STORE. The Allergology Solution is available for all ConceptDraw DIAGRAM users.

TEN RELATED HOW TO's:
Accounting is a cornerstone of any business, it’s basement. If you want to have a visual representation of your finance management, use audit flowchart symbols to document the money flow. Although some would say that accounting is boring, it is very a responsible duty. The audit flowchart symbols is supplied with ConceptDraw Audit Flowcharts solution as a vector objects library. Together with Conceptdraw Drawing capabilities it forms the helpful tool for audit process planning and setting the steps of audit by designing audit flow charts. Audit Flow charts are used to organize fiscal information tracking process as well as in accounting, finance and investment management.Audit Flowchart Symbols
Picture: Audit Flowchart Symbols
Related Solution:
Data structure diagram (DSD) is intended for description of conceptual models of data (concepts and connections between them) in the graphic format for more obviousness. Data structure diagram includes entities description, connections between them and obligatory conditions and requirements which connect them. Create Data structure diagram with ConceptDraw DIAGRAM.Data structure diagram with ConceptDraw DIAGRAM
Picture: Data structure diagram with ConceptDraw DIAGRAM
Diagramming is an astonishing way to visualize business processes. The list of the most common business process flowchart symbols is quite long starting from basic flowcharts, continuing with SIPOC diagrams. Business process modeling was never easier than now, with special ConceptDraw Business Process Mapping solution. To carry out all professional standard requirements for business processes mapping, it is necessarily to follow the special graphical notations. ConceptDraw Business Process Mapping solution offers an exhaustive suite of tools to aid business process mapping. There are three vector libraries SIPOC Diagrams, Business Process Flowcharts, and Swim Lanes that contains totally more than 50 symbols of standard BPM notations. This is all that professionals need to effectively evaluate and manage quality in business processes.Business Process Flowchart Symbols *
Picture: Business Process Flowchart Symbols
Related Solution:
If you need to describe some process, diagramming is a perfect tool for almost any imaginable purpose. The set of the most commonly used flow charts symbols is quite wide and includes symbols for operations, processes, data inputs and outputs. You can see the full list of all the symbols used for flowcharting in Flowcharts solution from Diagrams area in ConceptDraw Solution Park. A flow chart is often used for visual representation of a sequential process flow. The flowchart approach to any process is to divide it into some sequential actions. What makes a flow chart so popular and clear to make out is the set of standard flowchart symbols that has the same reading independently from processes described with their applying. The current drawing represents the vector library containing the pack of standard flowchart symbols. This library is supplied with ConceptDraw Flowcharts solution.Flow Chart Symbols
Picture: Flow Chart Symbols
Related Solution:
A flowchart is a simple but very functional tool when it comes to understanding a workflow or to removing unnecessary stages from a process. When drawing flowcharts, keep in mind that there are four common types of flowcharts, like document flowcharts and data flowcharts that show control over a data or document flow over a system. To show controls on a physical level, use system flowcharts. In addition, to show controls in a program, you can draw a program flowchart. This flowchart diagram represents the piece of an article editing process, that involves the author and editor. It was created using the Basic Flowchart notation that consists from the basic flowchart symbols. The start and the end of the process are indicated with "Terminator" symbols. The "Process" symbols show the action steps consisting from making edits and searching for a compromise, when the author does not agree with the suggestions of the editor. The "Process" symbol is the general symbol in process flowcharts. The "Decision" symbol indicates a branching in the process flow. There are two branches indicated by a Decision shape in the current flowchart (Yes/No, Disagree/Agree). This basic flowchart can be used as a repeating unit in the workflow diagram describing the working process of some editorial office.Types of Flowcharts *
Picture: Types of Flowcharts
Related Solution:
Use ConceptDraw DIAGRAM diagramming and business graphics software to draw your own flowcharts of computer algorithms.Process Flow app for macOS *
Picture: Process Flow app for macOS
Related Solution:
The ConceptDraw Flowchart component includes a set of samples and templates. This geathered as flowchart maker toolbox which focused on drawing flowcharts of any industry standards.Flowchart Components
Picture: Flowchart Components
Related Solution:
Data flow diagrams are the graphical tool, used in the visualization of data flow of some data processing systems. It is the valuable process modeling tool. Also designing DFD is the important component of the initial part of any information system development project. The standard symbols are used to represent the interaction of a system components and how various kinds of components influence on data flow. The ConceptDraw Data Flow Diagrams solution is design to assist professional software engineers in making DFDs according to Gane and Sarson, and Yourdon and Coad notations. Do you imagine yourself as a successful IT specialist? To your mind, they all use data flow diagram examples to learn and to get inspired. Aren’t you still with us?Data Flow Diagram Examples *
Picture: Data Flow Diagram Examples
Related Solution:
ConceptDraw DIAGRAM is a world-class diagramming platform that lets you display, communicate, and present dynamically. It′s powerful enough to draw everything from basic flowcharts to complex engineering schematics. Video tutorials on ConceptDraw products. Try it today!Business  Process Mapping — How to Map a Work Process *
Picture: Business Process Mapping — How to Map a Work Process
Related Solutions:
Event-Driven Process Chain Diagrams for improvement throughout an organisation. ConceptDraw DIAGRAM - software that reduces the time needed to create a business process model.Graphical Symbols to use in EPC diagrams *
Picture: Graphical Symbols to use in EPC diagrams
Related Solution:
ConceptDraw
DIAGRAM 18