Total Quality Management with ConceptDraw
 method - Fishbone diagram template")
This example was created on the base of the figure from the website of the Iowa State University Center for Excellence in Learning and Teaching.
"Fishbone.
What: The fishbone technique uses a visual organizer to identify the possible causes of a problem.
Benefits: This technique discourages partial or premature solutions and demonstrates the relative importance of, and interactions between, different parts of a problem.
How: On a broad sheet of paper, draw a long arrow horizontally across the middle of the page pointing to the right. Label the arrowhead with the title of the issue to be explained. This is the "backbone" of the "fish." Draw "spurs" from this "backbone" at about 45 degrees, one for every likely cause of the problem that the group can think of; and label each. Sub-spurs can represent subsidiary causes. The group considers each spur/ sub-spur, taking the simplest first, partly for clarity but also because a simple explanation may make more complex ones unnecessary. Ideally, the fishbone is redrawn so that position along the backbone reflects the relative importance of the different parts of the problem, with the most important at the head." [celt.iastate.edu/ creativity/ techniques.html]
The fishbone diagram example "Inability to meet project deadlines" was created using the ConceptDraw PRO diagramming and vector drawing software extended with the Fishbone Diagrams solution from the Management area of ConceptDraw Solution Park.
Ishikawa diagram

"Ishikawa diagrams (also called fishbone diagrams, herringbone diagrams, cause-and-effect diagrams, or Fishikawa) are causal diagrams created by Kaoru Ishikawa (1968) that show the causes of a specific event. Common uses of the Ishikawa diagram are product design and quality defect prevention, to identify potential factors causing an overall effect. Each cause or reason for imperfection is a source of variation. Causes are usually grouped into major categories to identify these sources of variation. The categories typically include:
- People: Anyone involved with the process
- Methods: How the process is performed and the specific requirements for doing it, such as policies, procedures, rules, regulations and laws
- Machines: Any equipment, computers, tools, etc. required to accomplish the job
- Materials: Raw materials, parts, pens, paper, etc. used to produce the final product
- Measurements: Data generated from the process that are used to evaluate its quality
- Environment: The conditions, such as location, time, temperature, and culture in which the process operates" [Ishikawa diagram. Wikipedia]
The fishbone diagram example "Causes of low-quality output" was created using the ConceptDraw PRO diagramming and vector drawing software extended with the Fishbone Diagrams solution from the Management area of ConceptDraw Solution Park.
Ishikawa diagram

The vector stencils library "Cause-and-effect diagram" contains 13 elements of fishbone diagram.
Use it to design your Ishikawa diagrams with ConceptDraw PRO diagramming and vector drawing software.
"Ishikawa diagrams (also called fishbone diagrams, herringbone diagrams, cause-and-effect diagrams, or Fishikawa) are causal diagrams created by Kaoru Ishikawa (1968) that show the causes of a specific event. Common uses of the Ishikawa diagram are product design and quality defect prevention to identify potential factors causing an overall effect. Each cause or reason for imperfection is a source of variation. Causes are usually grouped into major categories to identify these sources of variation. ...
The basic concept was first used in the 1920s, and is considered one of the seven basic tools of quality control." [Ishikawa diagram. Wikipedia]
The example of fishbone diagram shapes "Design elements - Cause-and-effect diagram" is included in the Seven Basic Tools of Quality solution from the Quality area of ConceptDraw Solution Park.
Fishbone diagram elements

This cause and effect diagram sample was redesigned from the Wikimedia Commons file: Fishbone BadCoffeeExample.jpg. [commons.wikimedia.org/ wiki/ File:Fishbone_ BadCoffeeExample.jpg]
This file is licensed under the Creative Commons Attribution-Share Alike 3.0 Unported license. [creativecommons.org/ licenses/ by-sa/ 3.0/ deed.en]
The fishbone diagram example "Bad coffee" was created using the ConceptDraw PRO diagramming and vector drawing software extended with the Fishbone Diagrams solution from the Management area of ConceptDraw Solution Park.
Fishbone diagram

"Cause-and-effect diagrams can reveal key relationships among various variables, and the possible causes provide additional insight into process behavior.
Causes can be derived from brainstorming sessions. These groups can then be labeled as categories of the fishbone. They will typically be one of the traditional categories mentioned above but may be something unique to the application in a specific case. Causes can be traced back to root causes with the 5 Whys technique." [Ishikawa diagram. Wikipedia]
"The 5 Whys is an iterative question-asking technique used to explore the cause-and-effect relationships underlying a particular problem. The primary goal of the technique is to determine the root cause of a defect or problem. (The "5" in the name derives from an empirical observation on the number of iterations typically required to resolve the problem.)" [5 Whys. Wikipedia]
This Ishikawa diagram (cause and effect diagram) template is included in the Fishbone Diagram solution from the Management area of ConceptDraw Solution Park.
Fishbone diagram

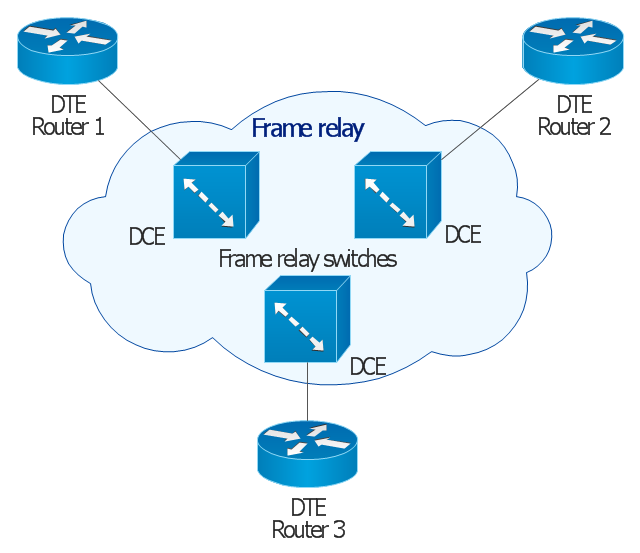
This Cisco network diagram example was redesigned from the Wikimedia Commons file: Frame relay.jpg. [commons.wikimedia.org/ wiki/ File:Frame_ relay.jpg]
This example depicts basic network diagram of a frame relay network.
"Frame relay is a standardized wide area network technology that specifies the physical and logical link layers of digital telecommunications channels using a packet switching methodology. Originally designed for transport across Integrated Services Digital Network (ISDN) infrastructure, it may be used today in the context of many other network interfaces.
Network providers commonly implement frame relay for voice (VoFR) and data as an encapsulation technique, used between local area networks (LANs) over a wide area network (WAN). Each end-user gets a private line (or leased line) to a frame relay node. The frame relay network handles the transmission over a frequently changing path transparent to all end-user extensively used WAN protocols. It is less expensive than leased lines and that is one reason for its popularity. The extreme simplicity of configuring user equipment in a frame relay network offers another reason for frame relay's popularity.
With the advent of Ethernet over fiber optics, MPLS, VPN and dedicated broadband services such as cable modem and DSL, the end may loom for the frame relay protocol and encapsulation. However many rural areas remain lacking DSL and cable modem services. In such cases, the least expensive type of non-dial-up connection remains a 64-kbit/ s frame relay line. Thus a retail chain, for instance, may use frame relay for connecting rural stores into their corporate WAN." [Frame Relay. Wikipedia]
The Cisco network diagram example "Frame relay" was created using the ConceptDraw PRO diagramming and vector drawing software extended with the Cisco Network Diagrams solution from the Computer and Networks area of ConceptDraw Solution Park.
Cisco network diagram
- Cafe Floor Plan Design Software | Landscape & Garden | Reason ...
- Semiconductor Devices Symbols With Reason
- Reason Diagram
- Fishbone diagram - Causes of low-quality output | Fishbone ...
- Fishbone diagram - Causes of low-quality output | Fish Bone Defect ...
- Ishikawa fishbone diagram | How to Draw a Fishbone Diagram with ...
- More reasons to eat fruits | Pictures of Food | Food Pictures | More ...
- Various Symbols To Draw Flow Chart And Its Reason
- Process Flowchart | Cause and Effect Diagrams | The Best Flowchart ...