A five level pyramid model of different types of Information Systems based on the information processing requirement of different levels in the organization. The first level represents transaction processing systems to process basic data. The second level represents office support systems to process information in office. The third level represents management information systems to process information by managers. The fourth level represents decision support systems to process explicit knowledge. The fifth level represents executive information systems to process tacit knowledge.
"A Computer(-Based) Information System is essentially an IS using computer technology to carry out some or all of its planned tasks. The basic components of computer based information system are:
(1) Hardware - these are the devices like the monitor, processor, printer and keyboard, all of which work together to accept, process, show data and information.
(2) Software - are the programs that allow the hardware to process the data.
(3) Databases - are the gathering of associated files or tables containing related data.
(4) Networks - are a connecting system that allows diverse computers to distribute resources.
(5) Procedures - are the commands for combining the components above to process information and produce the preferred output.
The first four components (hardware, software, database and network) make up what is known as the information technology platform. Information technology workers could then use these components to create information systems that watch over safety measures, risk and the management of data. These actions are known as information technology services." [Information systems. Wikipedia]
This pyramid diagram was redesigned using the ConceptDraw PRO diagramming and vector drawing software from Wikimedia Commons file Five-Level-Pyramid-model.png. [commons.wikimedia.org/ wiki/ File:Five-Level-Pyramid-model.png]
This file is licensed under the Creative Commons Attribution 3.0 Unported license. [creativecommons.org/ licenses/ by/ 3.0/ deed.en]
The triangle chart example "Information systems types" is included in the Pyramid Diagrams solution from the Marketing area of ConceptDraw Solution Park.
Pyramid diagram

A four level pyramid model of different types of Information Systems based on the different levels of hierarchy in an organization. The first level represents transaction processing systems for workers. The second level represents management information systems for middle managers. The third level represents decision support systems for senior menegers. The fourth level represents executive information systems for executives.
"The "classic" view of Information systems found in the textbooks in the 1980s was of a pyramid of systems that reflected the hierarchy of the organization, usually transaction processing systems at the bottom of the pyramid, followed by management information systems, decision support systems, and ending with executive information systems at the top. Although the pyramid model remains useful, since it was first formulated a number of new technologies have been developed and new categories of information systems have emerged, some of which no longer fit easily into the original pyramid model.
Some examples of such systems are:
data warehouses,
enterprise resource planning,
enterprise systems,
expert systems,
search engines,
geographic information system,
global information system,
office automation." [Information systems. Wikipedia]
This diagram was redesigned using the ConceptDraw PRO diagramming and vector drawing software from Wikimedia Commons file Four-Level-Pyramid-model.png. [commons.wikimedia.org/ wiki/ File:Four-Level-Pyramid-model.png]
This file is licensed under the Creative Commons Attribution-Share Alike 3.0 Unported license. [creativecommons.org/ licenses/ by-sa/ 3.0/ deed.en]
The triangle chart example "Information systems types" is included in the Pyramid Diagrams solution from the Marketing area of ConceptDraw Solution Park.
Pyramid diagram

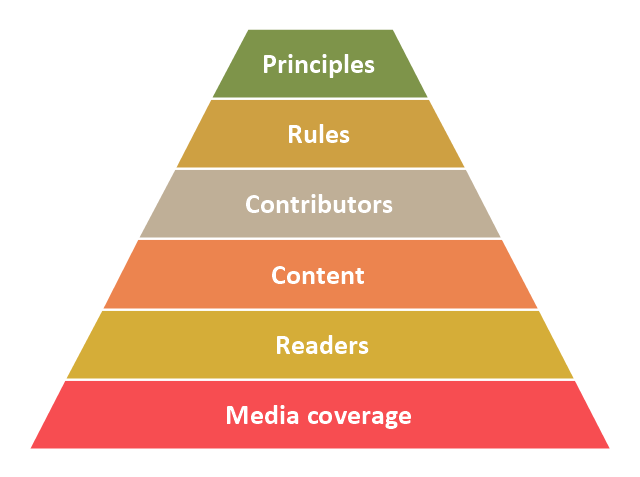
"Wikipedia's success metrics supersede each other in the following order:
1. Media coverage is the most basic metric for success – it provides notability and a public image for the project.
2. The number of readers supersedes media coverage – irrespective of the media, the number of actual readers matters more (high media coverage and low number of readers actually means the project is not successful; on the contrary, low media coverage and a high number of readers means the project is successful).
3. The quality and quantity of content is more important than the current number of readers – good content creates readership.
4. Content cannot be created without contributors, therefore the number of contributors and their ability to create meaningful content is more important than the current content.
5. Good contributors leave the project if they're not treated in a fair manner, and potential contributors are not interested in joining if they feel the project is misguided – therefore applying rules in a fair manner is more important than retaining contributors at any cost.
6. Misguided rules are guaranteed to ruin any enterprise, therefore all rules must necessarily be the result of applying healthy principles – the logic goes both ways, applying existing rules in fringe situations against the principles is disastrous." [Wikipedia's hierarchy of needs. Wikipedia]
This Wikipedia's hierarchy of priorities pyramid diagram was redesigned using the ConceptDraw PRO diagramming and vector drawing software from Wikimedia Commons file Wikipedia priority pyramid.png. [commons.wikimedia.org/ wiki/ File:Wikipedia_ priority_ pyramid.png]
This pyramid chart example is included in the Pyramid Diagrams solution from the Marketing area of ConceptDraw Solution Park.
Pyramid diagram
"Ecosystems represent sources of natural capital and provide goods and services to society, also called ecosystem services. The Millennium Ecosystem Assessment identified over 24 ecosystem services that can be divided up into 4 general groups including: 1) provisioning, 2) supporting, 3) regulating and 4) cultural." [User:Sawtoothgirl/ Sustainable Real Estate Development. Wikipedia]
"Humankind benefits in a multitude of ways from ecosystems. Collectively, these benefits are known as ecosystem services. Ecosystem services are regularly involved in the provisioning of clean drinking water and the decomposition of wastes. While scientists and environmentalists have discussed ecosystem services implicitly for decades, these the ecosystem services concept itself was popularized by the Millennium Ecosystem Assessment (MA) in the early 2000s. This grouped ecosystem services into four broad categories: provisioning, such as the production of food and water; regulating, such as the control of climate and disease; supporting, such as nutrient cycles and crop pollination; and cultural, such as spiritual and recreational benefits. To help inform decision-makers, many ecosystem services are being assigned economic values." [Ecosystem services. Wikipedia]
The segmented pyramid diagram example "Ecosystem goods and services" was redesigned using the ConceptDraw PRO diagramming and vector drawing software from Wikimedia Commons file ES_ triangle.png.
[commons.wikimedia.org/ wiki/ File:ES_ triangle.png]
This file is licensed under the Creative Commons Attribution-Share Alike 3.0 Unported license. [creativecommons.org/ licenses/ by-sa/ 3.0/ deed.en]
This segmented pyramid diagram example "Ecosystem goods and services" is included in the Pyramid Diagrams solution from the Marketing area of ConceptDraw Solution Park.
Pyramid diagram

"At the base of the identity of an organisational is its organizational culture. A culture is comprised of the shared values, customs, traditions, rituals, behaviours and beliefs shared by a social group (national, ethnic, organizational, etc.). Cultures also share languages, or ways of speaking. From a communication perspective, cultures are made and remade through the words we use to describe our world. Culture represents a common set of values (“shared meanings”), shared by members of a population, a organization, a project/ programme purpose unit or a profession (e.g., engineers versus scientists). Culture change with the times but the speed at which the culture of different institutions change varies widely." [Development Cooperation Handbook/ The development aid organization/ Organizational Culture. Wikibooks]
This organizational culture triangle diagram example derived from Parker and Benson's model. It's for explaination of the Regatta: Adoption Method.
The pyramid diagram example "Organizational culture" was redesigned using the ConceptDraw PRO diagramming and vector drawing software from Wikimedia Commons file Organization_ Triangle.png. [commons.wikimedia.org/ wiki/ File:Organization_ Triangle.png]
This file is licensed under the Creative Commons Attribution-Share Alike 2.5 Generic license. [creativecommons.org/ licenses/ by-sa/ 2.5/ deed.en]
The triangular chart sample "Organizational culture" is included in the Pyramid Diagrams solution from the Marketing area of ConceptDraw Solution Park.
Pyramid diagram

 Pyramid Diagrams
Pyramid Diagrams solution extends ConceptDraw PRO software with templates, samples and library of vector stencils for drawing the marketing pyramid diagrams.
- Pyramid diagrams - Vector stencils library | Directional Maps | Bar ...
- 4 Level pyramid model diagram - Information systems types ...
- Pyramid Diagram | Time, quality, money triangle diagram | Pyramid ...
- Organizational culture - Triangle diagram | Pyramid Diagram ...
- Hierarchy of laws | Typography Art | Pyramid Diagram | Png ...
- 3d Pyramid With 5 Levels Png
- Pyramid 3d Png
- SWOT Matrix Template | Process Flowchart | Pyramid Diagram ...
- System License Vector Png
- Pyramid Organization Symbol Png
- Organizational culture - Triangle diagram | Pyramid Diagram ...
- Glass Pyramid Vector Png
- Pyramid Diagram | Organizational Structure | Pyramid Diagram ...
- UML Activity Diagram | Fundraising Pyramid | Fishbone Diagrams ...
- Venn Diagrams | Pyramid Diagram | Stars Sustainable Development ...
- Ecosystem goods and services - Segmented pyramid diagram ...
- Pyramid Chart Examples | Pyramid Diagram | Priority pyramid ...
- Pyramid Diagram | 4 Level pyramid model diagram - Information ...
- Pyramid Diagram | Time, quality, money triangle diagram | Australia ...