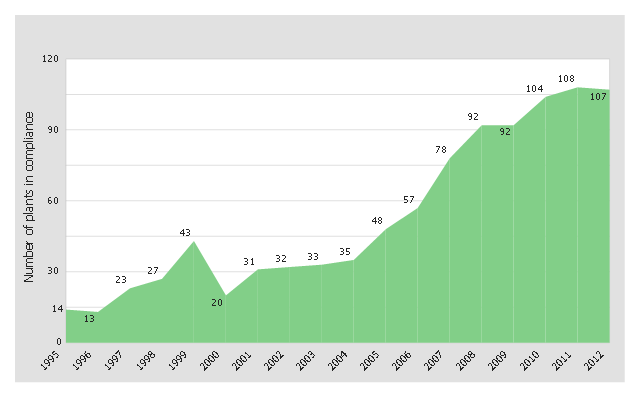
This area chart sample was redesigned from the picture "Outstanding trends of wastewater treatment plants" from the Washington State Department of Ecology website.
[ecy.wa.gov/ programs/ wq/ wastewater/ op_ cert/ kudos.html]
"Sewage treatment is the process of removing contaminants from wastewater and household sewage, both runoff (effluents), domestic, commercial and institutional. It includes physical, chemical, and biological processes to remove physical, chemical and biological contaminants. Its objective is to produce an environmentally safe fluid waste stream (or treated effluent) and a solid waste (or treated sludge) suitable for disposal or reuse (usually as farm fertilizer). Using advanced technology it is now possible to re-use sewage effluent for drinking water, although Singapore is the only country to implement such technology on a production scale in its production of NEWater." [Sewage treatment. Wikipedia]
The area graph example "Outstanding trends of wastewater treatment plants" was created using the ConceptDraw PRO diagramming and vector drawing software extended with the Area Charts solution from the Graphs and Charts area of ConceptDraw Solution Park.
Area chart
 Area Charts
Area Charts are used to display the cumulative totals over time using numbers or percentages; or to show trends over time among related attributes. The Area Chart is effective when comparing two or more quantities. Each series of data is typically represented with a different color, the use of color transparency in an object’s transparency shows overlapped areas and smaller areas hidden behind larger areas.
 Basic Area Charts
This solution extends the capabilities of ConceptDraw PRO v10.3.0 (or later) with templates, samples and a library of vector stencils for drawing Area Charts (area graphs) that visualize changes in values by filling in the area beneath the line connecting data points.
- Outstanding trends of wastewater treatment plants | United States ...
- Outstanding trends of wastewater treatment plants | Building ...
- Outstanding trends of wastewater treatment plants | Plumbing and ...
- Plant Layout Plans | How to Create a Plant Layout Design | Plant ...
- Singapore Plumbing Sample Drawings
- Domestic sector SWOT | Pie chart - Domestic energy consumption ...
- Waste Water Treatment Plant Eqient Symbols For Flowchart
- Sewage Line In Building Drawings
- Plant Layout Plans | Onion Diagram Process Design | Process flow ...
- Building Services Drawings For Waste Water
- Piping and instrumentation diagram template
- Building Drawing Software for Design Site Plan | Bubble diagrams ...
- How To use Landscape Design Software | Building Drawing ...
- Building Drawing Software for Designing Plumbing | Building ...
- Building Drawing Design Element: Storage and Distribution | Site ...
- Building Drawing Software for Design Site Plan | Site layout plan ...
- Marketing Diagrams | Fertilizer Product Plan Layout
- Flower Plant Png
- Vectors Of Plants For Garden Plans
- How To use House Electrical Plan Software | Building Drawing ...