 Picture Graphs
Typically, a Picture Graph has very broad usage. They many times used successfully in marketing, management, and manufacturing. The Picture Graphs Solution extends the capabilities of ConceptDraw PRO v10 with templates, samples, and a library of professionally developed vector stencils for designing Picture Graphs.
HelpDesk
How to Create a Picture Graph in ConceptDraw PRO

This picture bar graph sample shows regional population growth from 2010 to 2016. It was designed using data from the Wikipedia article List of continents by population.
[en.wikipedia.org/ wiki/ List_ of_ continents_ by_ population]
"Population geography is a division of human geography. It is the study of the ways in which spatial variations in the distribution, composition, migration, and growth of populations are related to the nature of places. Population geography involves demography in a geographical perspective. It focuses on the characteristics of population distributions that change in a spatial context." [Population geography. Wikipedia]
The pictorial chart example "Regional population growth from 2010 to 2016" was created using the ConceptDraw PRO diagramming and vector drawing software extended with the Picture Graphs solution from the Graphs and Charts area of ConceptDraw Solution Park.
Image chart

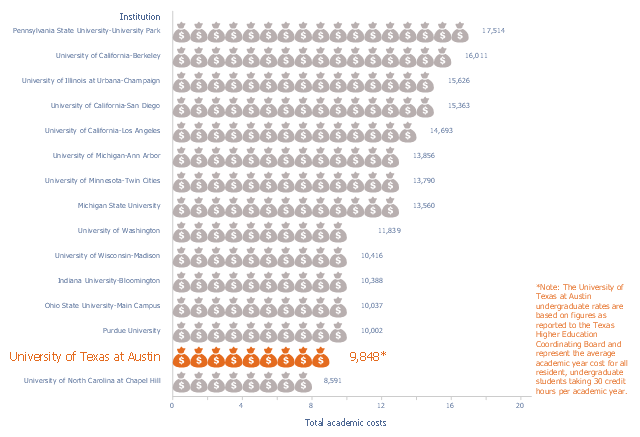
This picture bar graph sample shows the UT Austin Tuition Ranks 6th Compared to Other Texas Public Universities (Tuition and fees per semester, fall 2015). It was designed using data of the diagram "Compare UT Tuition" from the website of the University of Texas at Austin.
[tuition.utexas.edu/ compare]
The pictorial chart "Academic costs for residents, 2015-16" was created using the ConceptDraw PRO diagramming and vector drawing software extended with the Picture Graphs solution from the Graphs and Charts area of ConceptDraw Solution Park.
[tuition.utexas.edu/ compare]
The pictorial chart "Academic costs for residents, 2015-16" was created using the ConceptDraw PRO diagramming and vector drawing software extended with the Picture Graphs solution from the Graphs and Charts area of ConceptDraw Solution Park.
Pictorial chart
The vector stencils library "Picture bar graphs" contains 35 templates of pictorial charts. Use it for visualization of data comparison and time series with ConceptDraw PRO diagramming and vector drawing software.
"Pictorial bar graph.
Sometimes reffered to as a pictographs. A pictorial bar graph is a graph in which the rectangular bars have been filled with pictures, sketches, icons, etc. or where pictures, sketches, icons, etc. have been substituted for the rectangular bars. In both variations, one or more symbols might be used in each bar. The two major reasons for using pictorial graphs are to make the graph more appealing visually and to facilitate better communications." [Information Graphics: A Comprehensive Illustrated Reference. R. L. Harris. 1999. p.41]
The pictorial charts example "Design elements - Picture bar graphs" is included in the Picture Graphs solution from the Graphs and Charts area of ConceptDraw Solution Park.
Templates

 Value Stream Mapping
Value stream mapping solution extends ConceptDraw PRO software with templates, samples and vector stencils for drawing the Value Stream Maps (VSM) in lean manufacturing practice.
- Bar Graphs | Line Graphs | Sales Growth. Bar Graphs Example ...
- Picture Graph
- Picture Graphs | How to Create a Picture Graph in ConceptDraw ...
- Picture Graphs | Picture graphs - Vector stencils library | Picture ...
- How to Create a Picture Graph in ConceptDraw PRO | Marketing ...
- Picture Graphs | Sales Growth. Bar Graphs Example | Picture Graph ...
- Picture Graph | Pictures of Graphs | Sales Growth. Bar Graphs ...
- Picture Graphs | Picture Graph | Chart Examples | Images Of Best ...
- Design elements - Picture graphs | Picture Graphs | ConceptDraw ...
- Example A Picture Graph
- Picture Graphs | Pictures of Graphs | Area Charts | Population ...
- Picture Graphs | Design elements - Picture graphs | Picture Graph ...
- Picture graph - Template | Picture Graphs | Design elements ...
- Barrie population - Picture bar graph | Picture Graph | Sales Growth ...
- Picture Graphs | How to Draw a Line Graph | Line Graph | Line ...
- Design elements - Picture graphs | Pictorial Chart Imeges
- How to Draw a Line Graph | Line Graph | Picture Graphs | Images Of ...
- Picture Graphs | Histograms | ConceptDraw Solution Park | The ...
- Picture graphs - Vector stencils library | Total value of manufacturers ...
- Picture Graphs | ConceptDraw Solution Park | Total Quality ...