 Entity-Relationship Diagram (ERD)
Entity-Relationship Diagram (ERD) solution extends ConceptDraw PRO software with templates, samples and libraries of vector stencils from drawing the ER-diagrams by Chen's and crow’s foot notations.
"A credit card is a payment card issued to users as a system of payment. It allows the cardholder to pay for goods and services based on the holder's promise to pay for them. The issuer of the card creates a revolving account and grants a line of credit to the consumer (or the user) from which the user can borrow money for payment to a merchant or as a cash advance to the user." [Credit card. Wikipedia]
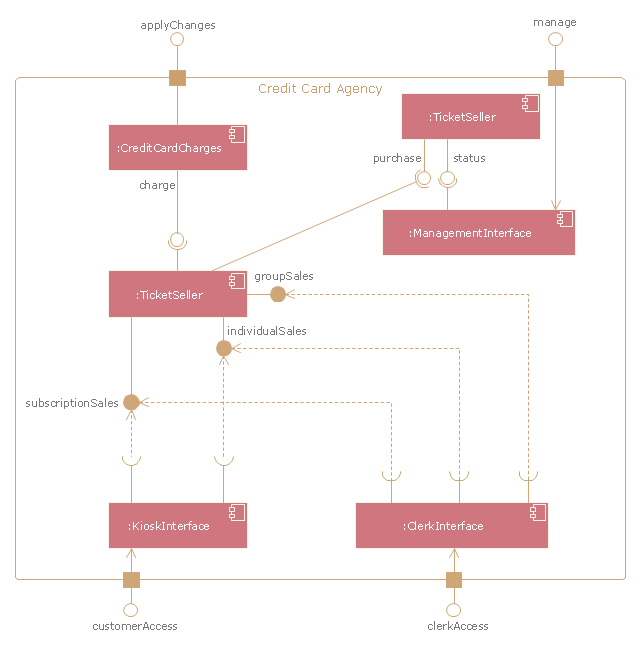
The UML component diagram example "Credit card agency" was created using the ConceptDraw PRO diagramming and vector drawing software extended with the Rapid UML solution from the Software Development area of ConceptDraw Solution Park.
The UML component diagram example "Credit card agency" was created using the ConceptDraw PRO diagramming and vector drawing software extended with the Rapid UML solution from the Software Development area of ConceptDraw Solution Park.
UML component diagram
 Rapid UML
Rapid UML solution extends ConceptDraw PRO software with templates, samples and libraries of vector stencils for quick drawing the UML diagrams using Rapid Draw technology.
 Event-driven Process Chain Diagrams
Event-driven Process Chain (EPC) Diagram is a type of flowchart widely used for modeling in business engineering and reengineering, business process improvement, and analysis. EPC method was developed within the Architecture of Integrated Information Systems (ARIS) framework.
 Entity-Relationship Diagram (ERD)
An Entity-Relationship Diagram (ERD) is a visual presentation of entities and relationships. That type of diagrams is often used in the semi-structured or unstructured data in databases and information systems. At first glance ERD is similar to a flowch
 Fishbone Diagram
Fishbone Diagrams solution extends ConceptDraw PRO software with templates, samples and library of vector stencils for drawing the Ishikawa diagrams for cause and effect analysis.
- Credit Card Processing System UML Diagram | UML Tool & UML ...
- Credit Card Processing System UML Diagram | Diagramming ...
- UML Diagram | UML Diagram Types List | UML Deployment ...
- Banking System | Bank System | UML Diagram | Package Diagram ...
- Class UML Diagram for Bank Account System | UML package ...
- Banking System | Bank System | Design elements - Bank UML ...
- UML package diagram for Bank account | Diagramming Software for ...
- Class UML Diagram for Bank Account System | UML package ...
- Package Diagram Of A Bank Account
- What Is Generalization In Uml
- DFD - Process of account receivable | Class UML Diagram for Bank ...
- Credit Card Processing System UML Diagram | UML Flowchart ...
- Credit Card Processing System UML Diagram | Credit Card Order ...
- UML Diagram | Banking System | Bank System | Package Diagram ...
- UML Use Case Diagram Example - Taxi Service
- Credit Card Processing Class Diagram In Software Engineering
- UML Class Diagram Generalization Example UML Diagrams
- UML Flowchart Symbols | UML Component Diagram | Swim Lane ...
- Credit Card Processing System UML Diagram | UML in 10 mins ...
- Credit Card Processing System UML Diagram | Basic Flowchart ...