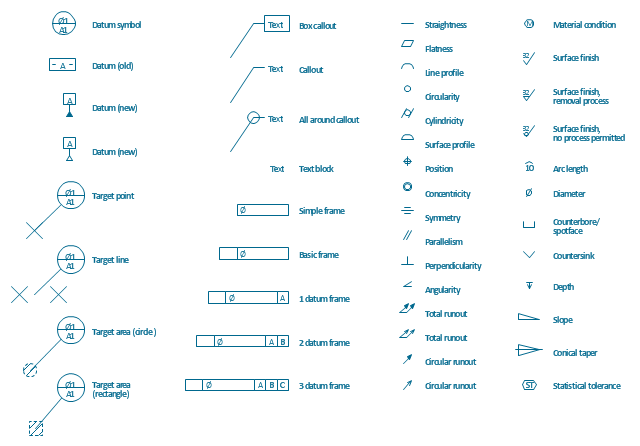
The vector stencils library "Dimensioning and tolerancing" contains 45 symbols of geometric dimensions and mechanical tolerances, geometric symbols, callouts, and text boxes and inserts.
Use these geometric dimensioning and tolerancing (GD&T) shapes to create annotated mechanical drawings.
"Geometric dimensioning and tolerancing (GD&T) is a system for defining and communicating engineering tolerances. It uses a symbolic language on engineering drawings and computer-generated three-dimensional solid models that explicitly describes nominal geometry and its allowable variation. It tells the manufacturing staff and machines what degree of accuracy and precision is needed on each controlled feature of the part. GD&T is used to define the nominal (theoretically perfect) geometry of parts and assemblies, to define the allowable variation in form and possible size of individual features, and to define the allowable variation between features." [Geometric dimensioning and tolerancing. Wikipedia]
The shapes example "Design elements - Dimensioning and tolerancing" was created using the ConceptDraw PRO diagramming and vector drawing software extended with the Mechanical Engineering solution from the ConceptDraw Solution Park.
Dimensioning and tolerancing symbols
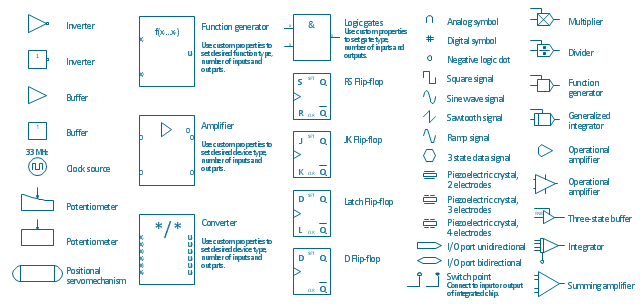
The vector stencils library "Analog and digital logic" contains 40 element symbols of logic (threshold) gates, bistable current switches, current controllers, regulators, electrical generators, and amplifiers.
Use it for drawing the digital and analog functions in electronic circuit diagrams and electrical schematics.
"Analogue electronics (or analog in American English) are electronic systems with a continuously variable signal, in contrast to digital electronics where signals usually take only two different levels. The term "analogue" describes the proportional relationship between a signal and a voltage or current that represents the signal." [Analogue electronics. Wikipedia]
"Digital electronics, or digital (electronic) circuits, represent signals by discrete bands of analog levels, rather than by a continuous range. All levels within a band represent the same signal state. Relatively small changes to the analog signal levels due to manufacturing tolerance, signal attenuation or parasitic noise do not leave the discrete envelope, and as a result are ignored by signal state sensing circuitry.
In most cases the number of these states is two, and they are represented by two voltage bands: one near a reference value (typically termed as "ground" or zero volts) and a value near the supply voltage, corresponding to the "false" ("0") and "true" ("1") values of the Boolean domain respectively.
Digital techniques are useful because it is easier to get an electronic device to switch into one of a number of known states than to accurately reproduce a continuous range of values.
Digital electronic circuits are usually made from large assemblies of logic gates, simple electronic representations of Boolean logic functions." [Digital electronics. Wikipedia]
The example "Design elements - Analog and digital logic" was drawn using the ConceptDraw PRO diagramming and vector drawing software extended with the Electrical Engineering solution from the Engineering area of ConceptDraw Solution Park.
Analog and digital logic elements
Network Diagram Software


 Cisco Network Diagrams
Cisco Network Diagrams solution extends ConceptDraw DIAGRAM with the best characteristics of network diagramming software. Included samples, templates and libraries of built-in standardized vector Cisco network icons and Cisco symbols of computers, network devices, network appliances and other Cisco network equipment will help network engineers, network designers, network and system administrators, as well as other IT professionals and corporate IT departments to diagram efficiently the network infrastructure, to visualize computer networks topologies, to design Cisco computer networks, and to create professional-looking Cisco Computer network diagrams, Cisco network designs and schematics, Network maps, and Network topology diagrams in minutes.
 Fault Tree Analysis Diagrams
This solution extends ConceptDraw DIAGRAM.5 or later with templates, fault tree analysis example, samples and a library of vector design elements for drawing FTA diagrams (or negative analytical trees), cause and effect diagrams and fault tree diagrams.
- Mechanical Engineering Tolerance Symbols
- Mechanical Drawing Symbols | Design elements - Dimensioning ...
- Mechanical Engineering Geometry Tolerance Symbol
- Design elements - Dimensioning and tolerancing | Mechanical ...
- Tolerance Symbol In Mechanical Drawing
- Design elements - Dimensioning and tolerancing | Process Flow ...
- Symbols For Mechanical Engineering Accuracy
- Machining Tolerance Symbols
- Mechanical Runout Symbols
- Design elements - Dimensioning and tolerancing | Design elements ...
- Geometrical Mechanical Symbol
- Symbol In Tolerance
- Mechanical Design Symbols Used In Parts Design
- Mechanical Drawing Symbols | Mechanical Engineering | CAD ...
- Mechanical Drawing Symbols | Basic Flowchart Symbols and ...
- Mathematics Symbols | Mechanical Drawing Symbols | Scientific ...
- Dimensioning and tolerancing - Vector stencils library | Design ...
- Design elements - Dimensioning and tolerancing | Examples of ...
- Mechanical Drawing Symbols | Mechanical Engineering ...
- Mechanical Drawing Symbols | Electrical Symbols — Rotating ...