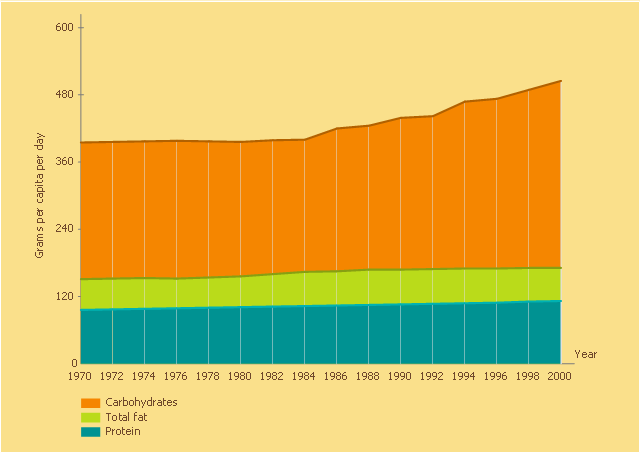
This area chart sample was designed on the base of line graph "Figure 9. U.S. food supply of macronutrients in grams per capita per day, 1970–2000. Data from Food Consumption Data System, Economic Research Service, U.S. Department of Agriculture" in the article "Childhood Obesity — What We Can Learn From Existing Data on Societal Trends, Part 2" by Roland Sturm from the website of the US Centers for Disease Control and Prevention (CDC).
"A line graph shows three lines, one indicating protein consumption, one indicating fat consumption, and one indicating carbohydrate consumption over a 31-year period, from 1970 to 2000. The line indicating protein remains fairly constant at the 100-gram level, increasing slightly from 96 grams in 1970 to 112 grams in 2000. The line indicating fat started at 151 grams in 1970, trending slightly upward after 1980, and reached 171 grams in 2000. The line indicating carbohydrates remains fairly constant from 1970 to 1982, starting at 395 grams in 1970 to 399 grams in 1982, but then rises steadily to reach 505 grams in 2000."
[cdc.gov/ pcd/ issues/ 2005/ apr/ 04_ 0039.htm#9]
The area graph example "U.S. food supply of macronutrients in grams per capita per day" was created using the ConceptDraw PRO diagramming and vector drawing software extended with the Area Charts solution from the Graphs and Charts area of ConceptDraw Solution Park.
Area chart
 Area Charts
Area Charts are used to display the cumulative totals over time using numbers or percentages; or to show trends over time among related attributes. The Area Chart is effective when comparing two or more quantities. Each series of data is typically represented with a different color, the use of color transparency in an object’s transparency shows overlapped areas and smaller areas hidden behind larger areas.