HelpDesk
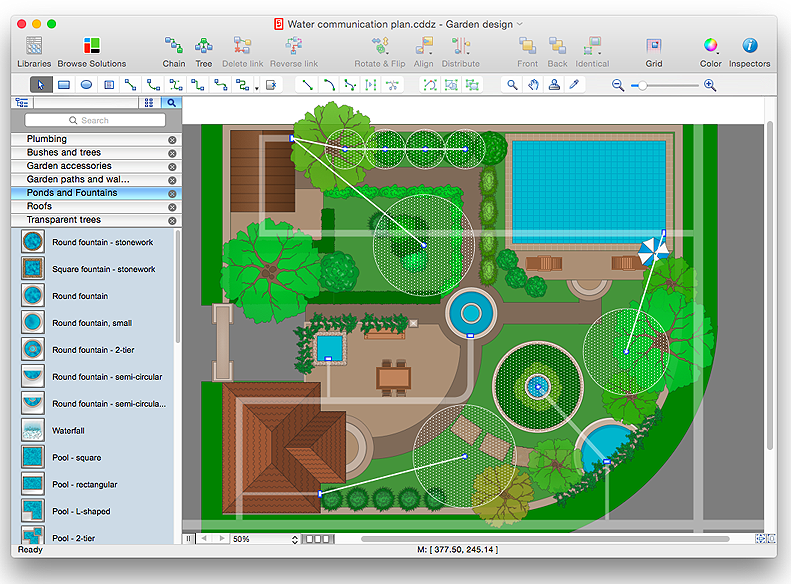
How to Design a Garden Using ConceptDraw PRO
Landscape and garden design involves a varied range of activities that can be managed using ConceptDraw Landscape and Garden solution. Landscape and garden design can embrace landscape management, engineering, detailing, urbanism, assessment and planning. The Landscape and Garden solution delivers the ability to sculpt your perfect garden design with a range of libraries and templates. These libraries include graphic design elements such as bushes and trees, flower and grass, ponds and fountains, garden furniture and accessories, and paths, plots and patios. Using them in combination with the handy templates included with the solution is the quickest and simplest method of starting to plan your garden design.HelpDesk
How to Draw a Pyramid Diagram in ConceptDraw PRO
Pyramid diagram (triangle diagram) is used to represent data, which have hierarchy and basics. Due to the triangular form of diagram, each pyramid section has a different width. The width of the segment shows the level of its hierarchy. Typically, the top of the pyramid is the data that are more important than the base data. Pyramid scheme can be used to show proportional and hierarchical relationships between some logically related items, such as departments within an organization, or successive elements of any process. This type of diagram is often used in marketing to display hierarchical related data, but it can be used in a variety of situations. ConceptDraw PRO allows you to make a pyramid diagram, quickly and easily using special libraries.
 Pyramid Diagrams
Pyramid Diagrams solution extends ConceptDraw PRO software with templates, samples and library of vector stencils for drawing the marketing pyramid diagrams.
HelpDesk
How to Draw a Gantt Chart Using ConceptDraw PRO
A Gantt chart is intended to provide a visualization of a project schedule. It is developed to help planning, coordinating, and tracking on project tasks implementation. One of the most critical resources for a project implementation is a time resources. Gantt chart - is one of the most convenient and popular way of graphical representation of a project tasks progress in conjunction with the corresponding time consumption. Gantt chart's function is to show project tasks completion in a progress, and to make a project manager sure that project tasks were completed on time. ConceptDraw Office is a clear and easy-to-use tool for project management. It is a very handy visual tool that helps make a project processing clear.
 Management Area
The solutions from Management area of ConceptDraw Solution Park collect templates, samples and libraries of vector stencils for drawing the management diagrams and mind maps.
 Bubble Diagrams
Bubble diagrams have enjoyed great success in software engineering, architecture, economics, medicine, landscape design, scientific and educational process, for ideas organization during brainstorming, for making business illustrations, presentations, planning, design, and strategy development. They are popular because of their simplicity and their powerful visual communication attributes.
- Bubble diagrams in Landscape Design with ConceptDraw PRO
- Bubble diagrams in Landscape Design with ConceptDraw PRO ...
- Bubble diagrams in Landscape Design with ConceptDraw PRO ...
- Process Flowchart | Value Stream Mapping | How to draw Metro ...
- Bubble diagrams in Landscape Design with ConceptDraw PRO ...
- How To Create Restaurant Floor Plan in Minutes | How To use ...
- How To Create Restaurant Floor Plan in Minutes | Building Drawing ...
- Sentence Diagram | Language Learning | Bubble diagrams in ...
- Emergency Plan | How To Create Restaurant Floor Plan in Minutes ...
- Bubble diagrams in Landscape Design with ConceptDraw PRO ...
- Bubble diagrams in Landscape Design with ConceptDraw PRO ...
- How to Add a Bubble Diagram to a PowerPoint Presentation Using ...
- Bubble diagrams in Landscape Design with ConceptDraw PRO ...
- How To Draw Building Plans | How To use House Electrical Plan ...
- Bubble diagrams in Landscape Design with ConceptDraw PRO ...
- Mac Tools - SWOT Analysis | Bubble diagrams in Landscape Design ...
- Bubble diagrams in Landscape Design with ConceptDraw PRO ...
- How to Exchange ConceptDraw MINDMAP Files with Mindjet ...
- Emergency Plan | Process Flowchart | How to Create a PowerPoint ...
- UML Diagram Types List


