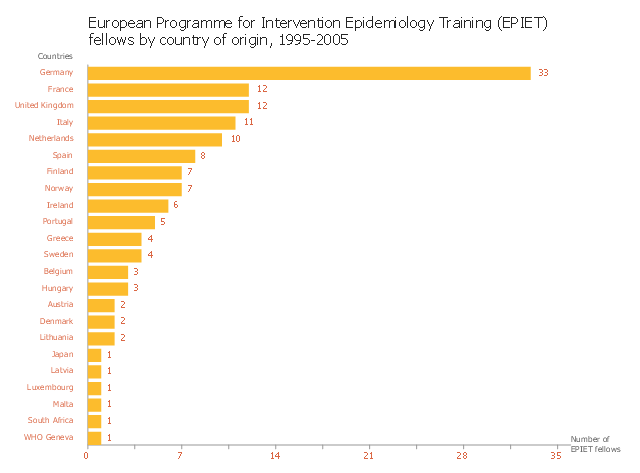
This horizontal bar graph sample shows distribution of European Programme for Intervention Epidemiology Training (EPIET) fellows by country of origin in 1995-2005. It was designed on the base of the bar chart from the website of the Field Epidemiology Manual (FEM) Wiki, the European Programme for Intervention Epidemiology Training (EPIET).
"The simplest bar graph displays data from a table with one variable. Each bar represents one category. Bar graphs can be organised horizontally or vertically. Vertical bars differ from histograms since they are separated by a space. The height of the bar is proportional to the number of events (e.g. cases) in the category, nevertheless the surface is not always proportional to the width of the category on the x-axis (e.g. different width of age groups). If there is a logical order between categories it should be respected. Otherwise categories can be organised along decreasing or increasing values of respective bars. Variables in a bar graph can be discrete (e.g. sex, region, race) or continuous (e.g. age) but organised in categories (e.g. age groups). The x axis does not need to be continuous." [wiki.ecdc.europa.eu/ fem/ w/ wiki/ bar-graphs]
The bar chart example "EPIET fellows by country of origin" was created using the ConceptDraw PRO diagramming and vector drawing software extended with the Bar Graphs solution from the Graphs and Charts area of ConceptDraw Solution Park.
Bar chart
 Bar Graphs
The Bar Graphs solution enhances ConceptDraw PRO v10 functionality with templates, numerous professional-looking samples, and a library of vector stencils for drawing different types of Bar Graphs, such as Simple Bar Graph, Double Bar Graph, Divided Bar Graph, Horizontal Bar Graph, Vertical Bar Graph, and Column Bar Chart.
 Circle-Spoke Diagrams
Examples of subject areas that are well suited to this approach are marketing, business, products promotion, process modeling, market, resource, time, and cost analysis. Circle-Spoke Diagrams are successfully used in presentations, conferences, management documents, magazines, reportages, reviews, reports, TV, and social media.
- What Do You Mean By Fellow Chart Explain The Various Symbols
- Draw The Various Boxes Used In A Flow Chart And Explain
- Hr Management Flow Chart
- Bar Diagrams for Problem Solving. Create manufacturing and ...
- Whst Is Flow Chart Explain The Various Symbol In Flowchart With ...
- Bar Graph | Serious crime in Cincinnati | Bar Diagrams for Problem ...
- Basic Flowchart Symbols and Meaning | ERD Symbols and ...
- SmartAmerica Challenge - Timeline | Internet Of Things Healthcare
- SmartAmerica Challenge - Timeline | Tax Time 2013 - System ...
- Data flow Model Diagram