HelpDesk
How to Draw a Fishbone Diagram with ConceptDraw PRO

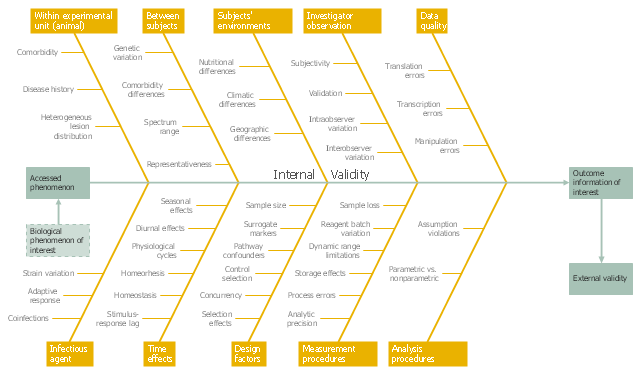
This example was created on the base of the figure from the website of the WSU College of Veterinary Medicine of the Washington State University. [vetmed.wsu.edu/ courses-jmgay/ images/ Ishikawa%20 Variance%20 Diagram.jpg]
"Internal validity is a property of scientific studies which reflects the extent to which a causal conclusion based on a study is warranted. Such warrant is constituted by the extent to which a study minimizes systematic error (or 'bias')." [Internal validity. Wikipedia]
The fishbone diagram example "Ishikawa variance diagram" was created using the ConceptDraw PRO diagramming and vector drawing software extended with the Fishbone Diagrams solution from the Management area of ConceptDraw Solution Park.
Ishikawa diagram
- Ishikawa Diagram | Fishbone Diagram Example | Ishikawa fishbone ...
- Fishbone Diagram Example | Ishikawa Diagram | Using Fishbone ...
- Quality fishbone diagram - Template | Ishikawa fishbone diagram ...
- Fishbone Diagram Example For Service Industry
- Ishikawa Diagram | Using Fishbone Diagrams for Problem Solving ...
- Fishbone Diagram Example | Ishikawa Diagram | Fishbone Diagram ...
- Ishikawa Diagram For System Development
- Ishikawa Diagram Examples
- Fishbone Diagrams | Example of DFD for Online Store (Data Flow ...
- Ishikawa Diagram | Fishbone Diagram Example | Using Fishbone ...
- Ishikawa fishbone diagram | Fishbone diagram - Bad coffee | Cause ...
- Example Of Ishikawa Diagram
- Cause And Effect Analysis Example
- Fishbone Diagram | Fishbone Diagram Example | Ishikawa Diagram ...
- Examples Of Fishbone Map
- How to Create a Fishbone ( Ishikawa ) Diagram Quickly | Ishikawa ...
- Fishbone Diagram | Workflow Diagram Examples | Fishbone ...
- Ishikawa Diagram | Draw Fishbone Diagram on MAC Software ...
- Ishikawa Diagram For Problem Defective Product
- Fishbone diagram - Production process