Cubetto Flowchart

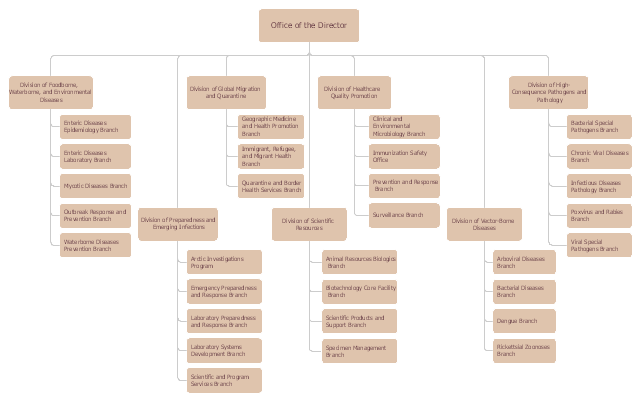
This example is based on the organizational chart from the NCEZID website. [cdc.gov/ ncezid/ org-ncezid.html]
"The National Center for Emerging and Zoonotic Infectious Diseases aims to prevent disease, disability, and death caused by a wide range of infectious diseases. We focus on diseases that have been around for many years, emerging diseases (those that are new or just recently identified), and zoonotic diseases (those spread from animals to people). Our work is guided in part by a holistic "One Health" strategy, which recognizes the vital interconnectedness of microbes and the environment. Through a comprehensive approach involving many scientific disciplines, we can attain better health for humans and animals and improve our environment.
To carry out our mission, we use many different tactics: providing leadership in public health, conducting exemplary science, strengthening preparedness efforts, establishing public health policy, sharing vital health information with the public, and building partnerships. Each of the center’s seven divisions works with partners to protect and improve the public’s health in the United States and worldwide." [cdc.gov/ ncezid/ ]
The organizational chart example "National Center for Emerging and Zoonotic Infectious Diseases" was created using the ConceptDraw PRO diagramming and vector drawing software extended with the Organizational Charts solution from the Management area of ConceptDraw Solution Park.
Organizational chart - National Center for Emerging and Zoonotic Infectious Diseases
HelpDesk
How to Draw a Pie Chart Using ConceptDraw PRO

- How to Draw an Organization Chart | How to Draw an ...
- Draw And Explain Organizational Structure Of A Medium And Large ...
- Draw An Organizational Chart In A Small Hotel And Large
- Small Business Organizational Chart
- Organizational Structure | Organization Chart Software | Virtual ...
- Draw The Organisational Chart For A Small Hotel
- Small Hotel Organizational Chart
- Draw And Explain Organization Structure Of Medium And Large Hotel
- Typical Drawing Of Small Medium And Large Organizational Chart
- Sample Organizational Chart For Small Business
- Draw An Organizational Charts Of Small Hotel
- Draw An Organization Chart Of A Small Hotel
- SWOT analysis for a small independent bookstore | Competitor ...
- Organizational chart - University leadership | SWOT analysis for a ...
- Organization chart - Foodbank | Online Flow Chart | SWOT Analysis ...
- Successful Strategic Plan | SWOT analysis for a small independent ...
- Data Flow Diagram Model | Functional Organizational Structure ...
- Organizational Structure | IDEF0 standard with ConceptDraw PRO ...
- Organizational Charts | Basic Flowchart Symbols and Meaning ...