HelpDesk
How to Draw a Line Chart Quickly

This vector stencils library contains 26 IDEF0 diagram symbols.
Use it for business process modeling with IDEF0 diagrams using ConceptDraw PRO diagramming and vector drawing tools.
The vector stencils library "IDEF0" is included in the IDEF Business Process Diagrams solution from the Business Processes area of ConceptDraw Solution Park.
Use it for business process modeling with IDEF0 diagrams using ConceptDraw PRO diagramming and vector drawing tools.
The vector stencils library "IDEF0" is included in the IDEF Business Process Diagrams solution from the Business Processes area of ConceptDraw Solution Park.
Box
Label

Side text callout
Mid text callout
Model note
Reader note
Text note

Node
Diagram form
Standard diagram form
Straight line segment

Straight line arrow segment
Curved arrow segment
Tunneled arrow
Dotted line

Input arrow
Output arrow
Control arrow
Mechanism arrow
Call arrow
Forking arrows

Joining arrows

Control feedback - up and over
Input feedback - down and under
Mechanism feedback - down and under
Node tree
The vector stencils library "Line graphs" contains 5 templates of line graphs and scatter charts for visualizing data changes over time. Drag a template from the library to your document and enter your data.
Use these shapes to draw your line and scatter charts in the ConceptDraw PRO diagramming and vector drawing software.
The vector stencils library "Line graphs" is included in the Line Graphs solution from the Graphs and Charts area of ConceptDraw Solution Park.
Use these shapes to draw your line and scatter charts in the ConceptDraw PRO diagramming and vector drawing software.
The vector stencils library "Line graphs" is included in the Line Graphs solution from the Graphs and Charts area of ConceptDraw Solution Park.
Line graph (text -> height)
-line-graphs---vector-stencils-library.png--diagram-flowchart-example.png)
Line graph (control dots)
-line-graphs---vector-stencils-library.png--diagram-flowchart-example.png)
Scatter chart (text -> height)
-line-graphs---vector-stencils-library.png--diagram-flowchart-example.png)
Scatter chart (control dots)
-line-graphs---vector-stencils-library.png--diagram-flowchart-example.png)
Line chart - serial
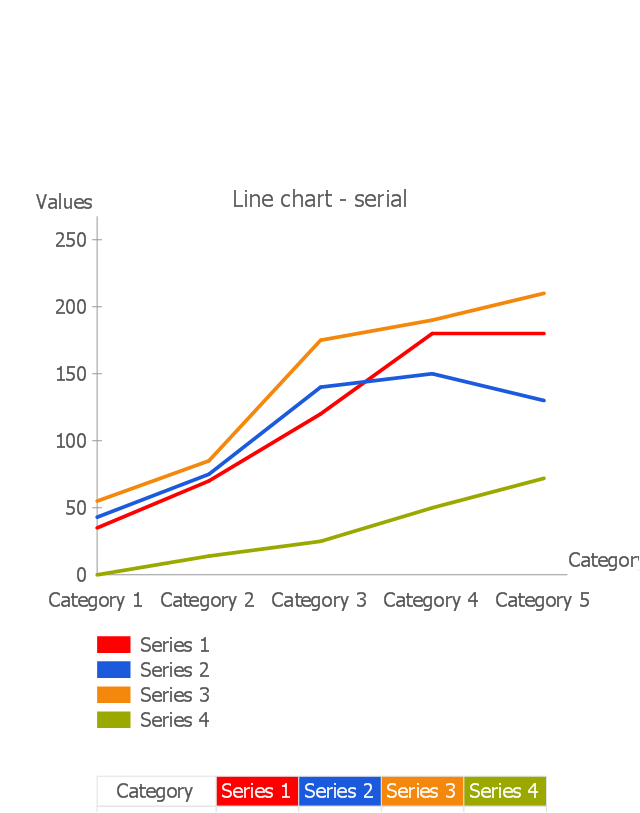
"A chart can take a large variety of forms, however there are common features that provide the chart with its ability to extract meaning from data.
Typically the data in a chart is represented graphically, since humans are generally able to infer meaning from pictures quicker than from text. Text is generally used only to annotate the data.
One of the more important uses of text in a graph is the title. A graph's title usually appears above the main graphic and provides a succinct description of what the data in the graph refers to.
Dimensions in the data are often displayed on axes. If a horizontal and a vertical axis are used, they are usually referred to as the x-axis and y-axis respectively. Each axis will have a scale, denoted by periodic graduations and usually accompanied by numerical or categorical indications. Each axis will typically also have a label displayed outside or beside it, briefly describing the dimension represented. If the scale is numerical, the label will often be suffixed with the unit of that scale in parentheses. ...
Within the graph a grid of lines may appear to aid in the visual alignment of data. The grid can be enhanced by visually emphasizing the lines at regular or significant graduations. The emphasized lines are then called major grid lines and the remainder are minor grid lines.
The data of a chart can appear in all manner of formats, and may include individual textual labels describing the datum associated with the indicated position in the chart. The data may appear as dots or shapes, connected or unconnected, and in any combination of colors and patterns. Inferences or points of interest can be overlaid directly on the graph to further aid information extraction.
When the data appearing in a chart contains multiple variables, the chart may include a legend (also known as a key). A legend contains a list of the variables appearing in the chart and an example of their appearance. This information allows the data from each variable to be identified in the chart." [Chart. Wikipedia]
The vector stencils library "Time series charts" contains 10 templates: 3 column charts, 3 bar charts, 2 line graphs and 2 dot plots. All these charts are Live Objects displaying the data from external data source files.
Use these chart templates to design your business performance digital dashboards using the ConceptDraw PRO diagramming and vector drawing software.
The example "Design elements - Time series charts" is included in the Time Series Dashboard solution from the area "What is a Dashboard" of ConceptDraw Solution Park.
Time series charts
The vector stencils library "Line graphs" contains 5 templates of line graphs and scatter charts for visualizing data changes over time. Drag a template from the library to your document and enter your data.
Use these shapes to draw your line and scatter charts in the ConceptDraw PRO diagramming and vector drawing software.
The vector stencils library "Line graphs" is included in the Line Graphs solution from the Graphs and Charts area of ConceptDraw Solution Park.
Use these shapes to draw your line and scatter charts in the ConceptDraw PRO diagramming and vector drawing software.
The vector stencils library "Line graphs" is included in the Line Graphs solution from the Graphs and Charts area of ConceptDraw Solution Park.
Line graph (text -> height)
Line graph (control dots)
Scatter chart (text -> height)
Scatter chart (control dots)
Line chart - serial
The vector stencils library "Transport map" contains 96 pictograms for drawing transport maps.
Use it in your spatial infographics for visual representation of transport schemes and plans as metro maps in the ConceptDraw PRO diagramming and vector drawing software extended with the Spatial Infographics solution from the area "What is Infographics" of ConceptDraw Solution Park.
Use it in your spatial infographics for visual representation of transport schemes and plans as metro maps in the ConceptDraw PRO diagramming and vector drawing software extended with the Spatial Infographics solution from the area "What is Infographics" of ConceptDraw Solution Park.
Train Railway

Bus Stop

Tramlink

Marina/Ferry Dock

Information Center

Information Center

Airport

Airport

Underground/Subway/Metro

Underground/Subway/Metro

National Rail Train Station

Taxi

Taxi

Parking

Parking

Parking

Parking

Bicycle Parking

Bicycle Parking

Fuel/Gas/Petrol

Fuel/Gas/Petrol

Police

Police

Hospital

Hospital

Wheelchair Access

Wheelchair Access

First Aid

First Aid

Telephone

Telephone

Post Office

Post Office

Landmarks and Museums

Landmarks and Museums

University

University

Shopping/Supermarket

Shopping/Supermarket

Cafe

Cafe

Food and Drinks

Food and Drinks

Man

Woman

Restrooms/Toilets

Restrooms/Toilets

Park

Park

Zoo

Zoo

Hotel

Hotel

Camping

Camping

City

Skyscraper

Building

Ocean

Straight River

Flexible River

Bridge

North Arrow
Viewpoint

Scale
Road line

Road rounded line

Road corner

Road curve 1

Road curve 2
Crossroads

Roundabout
Cloverleaf interchange

Roadway break

Railway line

Railway curve
Railway fork
Standard line with standard station - basic road

Thick line with standard station - basic road

Standard line with rectangular station - basic road

Thick line with rectangular station - basic road

Standard line with standard station - double road

Thick line with standard station - double road

Standard line with rectangular station - double road

Thick line with rectangular station - double road

Standard line with standard station - dotted road

Thick line with standard station - dotted road

Standard line with rectangular station - dotted road
Thick line with rectangular station - dotted road

Interchange Station Vertical

Interchange Station Horizontal

Transfer Station 1

Transfer Station 2
Transfer Station 3
Line Notation

Street direction
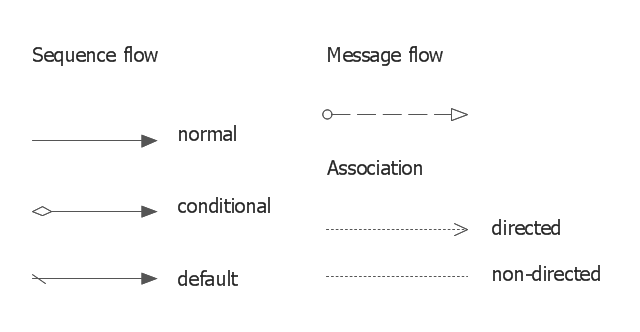
The vector stencils library "Connections BPMN1.2" contains 6 connection symbols of sequence flow, message flow, and association.
Use these shapes for drawing business process diagrams (BPMN 1.2) using the ConceptDraw PRO diagramming and vector drawing software.
"Connections.
Flow objects are connected to each other using Connecting objects, which are of three types: sequences, messages, and associations.
(1) Sequence Flow.
A Sequence Flow is represented with a solid line and arrowhead, and shows in which order the activities are performed. The sequence flow may also have a symbol at its start, a small diamond indicates one of a number of conditional flows from an activity, while a diagonal slash indicates the default flow from a decision or activity with conditional flows.
(2) Message Flow.
A Message Flow is represented with a dashed line, an open circle at the start, and an open arrowhead at the end. It tells us what messages flow across organizational boundaries (i.e., between pools). A message flow can never be used to connect activities or events within the same pool.
(3) Association.
An Association is represented with a dotted line. It is used to associate an Artifact or text to a Flow Object, and can indicate some directionality using an open arrowhead (toward the artifact to represent a result, from the artifact to represent an input, and both to indicate it is read and updated). No directionality is used when the Artifact or text is associated with a sequence or message flow (as that flow already shows the direction)." [Business Process Model and Notation. Wikipedia]
The example "Design elements - Connections BPMN1.2" is included in the Business Process Diagram solution from the Business Processes area of ConceptDraw Solution Park.
BPMN1.2 connection symbols
IDEF1X Standard

- Airplane Vector Dotted Line Png
- Dotted Curves Arrow Png
- Png Double Line
- Png Photoshop Architecture Arrows Doted Lines
- White Dotted Line Corner Png
- Straight Line Png
- Road Line Png
- Metro Vector Png
- Time Series Graph Png
- Dashed Connector Png
- Straight Black Line Png
- Hotel Taxi Vector Png
- Hospital Vector Png
- Dotted Arrow Line
- Flowchart Dotted Line
- Taxi Service Data Flow Diagram DFD Example | UML Use Case ...
- Map Line Scale Png
- Line Graph Grammer And Connectors
- Air Flow Arrow Png
- Dotted Arrow In Conceptdraw Pro