A four level pyramid model of different types of Information Systems based on the different levels of hierarchy in an organization. The first level represents transaction processing systems for workers. The second level represents management information systems for middle managers. The third level represents decision support systems for senior menegers. The fourth level represents executive information systems for executives.
"The "classic" view of Information systems found in the textbooks in the 1980s was of a pyramid of systems that reflected the hierarchy of the organization, usually transaction processing systems at the bottom of the pyramid, followed by management information systems, decision support systems, and ending with executive information systems at the top. Although the pyramid model remains useful, since it was first formulated a number of new technologies have been developed and new categories of information systems have emerged, some of which no longer fit easily into the original pyramid model.
Some examples of such systems are:
data warehouses,
enterprise resource planning,
enterprise systems,
expert systems,
search engines,
geographic information system,
global information system,
office automation." [Information systems. Wikipedia]
This diagram was redesigned using the ConceptDraw PRO diagramming and vector drawing software from Wikimedia Commons file Four-Level-Pyramid-model.png. [commons.wikimedia.org/ wiki/ File:Four-Level-Pyramid-model.png]
This file is licensed under the Creative Commons Attribution-Share Alike 3.0 Unported license. [creativecommons.org/ licenses/ by-sa/ 3.0/ deed.en]
The triangle chart example "Information systems types" is included in the Pyramid Diagrams solution from the Marketing area of ConceptDraw Solution Park.
Pyramid diagram

A five level pyramid model of different types of Information Systems based on the information processing requirement of different levels in the organization. The first level represents transaction processing systems to process basic data. The second level represents office support systems to process information in office. The third level represents management information systems to process information by managers. The fourth level represents decision support systems to process explicit knowledge. The fifth level represents executive information systems to process tacit knowledge.
"A Computer(-Based) Information System is essentially an IS using computer technology to carry out some or all of its planned tasks. The basic components of computer based information system are:
(1) Hardware - these are the devices like the monitor, processor, printer and keyboard, all of which work together to accept, process, show data and information.
(2) Software - are the programs that allow the hardware to process the data.
(3) Databases - are the gathering of associated files or tables containing related data.
(4) Networks - are a connecting system that allows diverse computers to distribute resources.
(5) Procedures - are the commands for combining the components above to process information and produce the preferred output.
The first four components (hardware, software, database and network) make up what is known as the information technology platform. Information technology workers could then use these components to create information systems that watch over safety measures, risk and the management of data. These actions are known as information technology services." [Information systems. Wikipedia]
This pyramid diagram was redesigned using the ConceptDraw PRO diagramming and vector drawing software from Wikimedia Commons file Five-Level-Pyramid-model.png. [commons.wikimedia.org/ wiki/ File:Five-Level-Pyramid-model.png]
This file is licensed under the Creative Commons Attribution 3.0 Unported license. [creativecommons.org/ licenses/ by/ 3.0/ deed.en]
The triangle chart example "Information systems types" is included in the Pyramid Diagrams solution from the Marketing area of ConceptDraw Solution Park.
Pyramid diagram

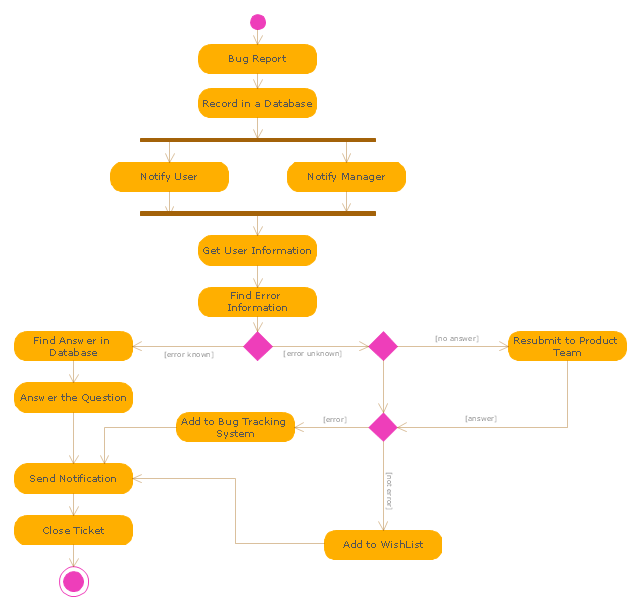
"An issue tracking system (also ITS, trouble ticket system, support ticket, request management or incident ticket system) is a computer software package that manages and maintains lists of issues, as needed by an organization. Issue tracking systems are commonly used in an organization's customer support call center to create, update, and resolve reported customer issues, or even issues reported by that organization's other employees. An issue tracking system often also contains a knowledge base containing information on each customer, resolutions to common problems, and other such data. An issue tracking system is similar to a "bugtracker", and often, a software company will sell both, and some bugtrackers are capable of being used as an issue tracking system, and vice versa. Consistent use of an issue or bug tracking system is considered one of the "hallmarks of a good software team".
A ticket element, within an issue tracking system, is a running report on a particular problem, its status, and other relevant data. They are commonly created in a help desk or call center environment and almost always have a unique reference number, also known as a case, issue or call log number which is used to allow the user or help staff to quickly locate, add to or communicate the status of the user's issue or request.
These tickets are so called because of their origin as small cards within a traditional wall mounted work planning system when this kind of support started. Operators or staff receiving a call or query from a user would fill out a small card with the user's details and a brief summary of the request and place it into a position (usually the last) in a column of pending slots for an appropriate engineer, so determining the staff member who would deal with the query and the priority of the request." [Issue tracking system. Wikipedia]
The UML activity diagram example "Ticket processing system" was created using the ConceptDraw PRO diagramming and vector drawing software extended with the Rapid UML solution from the Software Development area of ConceptDraw Solution Park.
UML activity diagram
"Classic TQM Tools ...
Flow Charts Pictures, symbols or text coupled with lines, arrows on lines show direction of flow. Flowcharting enables
modeling of processes; problems/ opportunities and decision points etc. It develops a common understanding of a process by those in
volved." [whaqualitycenter.org/ Portals/ 0/ Tools%20 to%20 Use/ Classic%20 Quality%20 Tools/ Classic%20 TQM%20 Tools%20 R%20 2-12.pdf]
The vector stencils library TQM diagrams contains 58 symbols for drawing total quality management (TQM) flow charts using the ConceptDraw PRO diagramming and vector drawing software.
The example "Design elements - TQM diagram" is included in the Total Quality Management (TQM) Diagrams solution from the Quality area of ConceptDraw Solution Park.
TQM flow chart symbols

- 4 Level pyramid model diagram - Information systems types | 5 Level ...
- Chart Of Management Information System With Diagram
- 4 Level pyramid model diagram - Information systems types ...
- 5 Level pyramid model diagram - Information systems types
- Operational Support System Diagram
- Management Information System Triangle Diagram
- With The Aid Of Diagram Explain Management Information System
- Example For Management Information System With Diagram
- Diagrams Of Level Management
- Pyramid Diagram | 5 Level pyramid model diagram - Information ...
- Management Information System Charts And Diagrams
- Business Support System Block Diagram
- Pyramid Diagram | 4 Level pyramid model diagram - Information ...
- 4 Level pyramid model diagram - Information systems types | 5 Level ...
- Pyramid Diagram | Pyramid Diagram | 4 Level pyramid model ...
- 4 Level pyramid model diagram - Information systems types ...
- Pyramid Diagram | 4 Level pyramid model diagram - Information ...
- Charts In Management Information Syatem
- Decision Support System Flow Diagram
- Systems Management Diagram