HelpDesk
How to Create an ERD Diagram
 using Chen's notation")
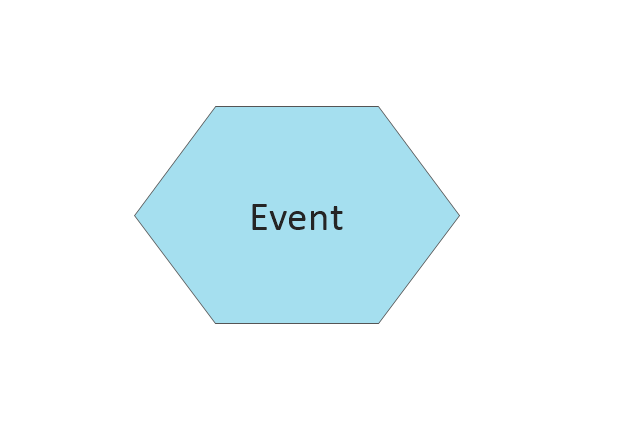
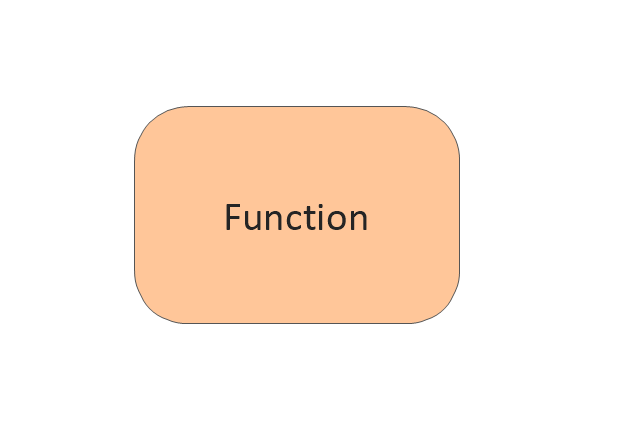
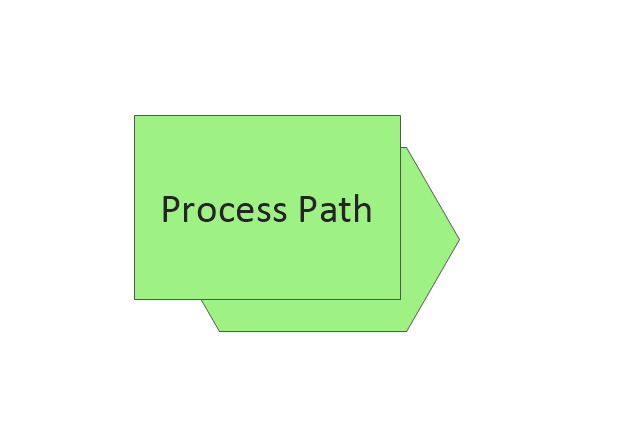
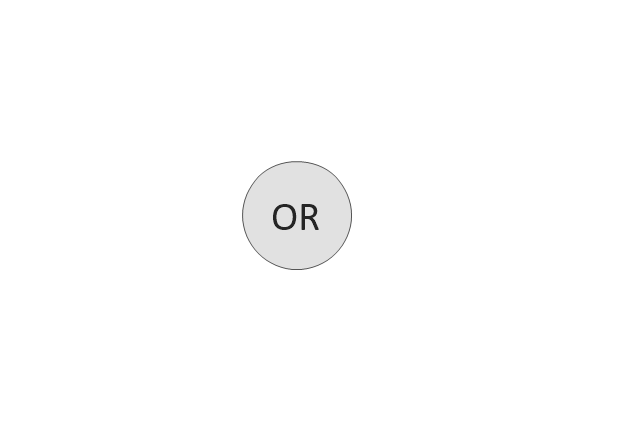
The vector stencils library "EPC diagrams" contains 23 EPC symbols.
Use it for drawing event-driven process chain (EPC) diagrams in the ConceptDraw PRO diagramming and vector drawing software extended with the Event-driven Process Chain Diagrams solution from the Business Processes area of ConceptDraw Solution Park.
www.conceptdraw.com/ solution-park/ business-process-EPC
Event
Function
Process path
XOR operator

OR operator
AND operator

Information/ Material Object
Organization Unit
Process Group
System
Comment 1

Comment 2

Control flow (Direct)
-epc-diagrams---vector-stencils-library.png--diagram-flowchart-example.png)
Information flow (Direct)
-epc-diagrams---vector-stencils-library.png--diagram-flowchart-example.png)
Organiztion unit assignment (Direct)
-epc-diagrams---vector-stencils-library.png--diagram-flowchart-example.png)
Control flow (Smart)
-epc-diagrams---vector-stencils-library.png--diagram-flowchart-example.png)
Information flow (Smart)
-epc-diagrams---vector-stencils-library.png--diagram-flowchart-example.png)
Organiztion unit assignment (Smart)
-epc-diagrams---vector-stencils-library.png--diagram-flowchart-example.png)
Information
Enterprise Area
Document
Database
Disk Storage
"Flow Charts ...
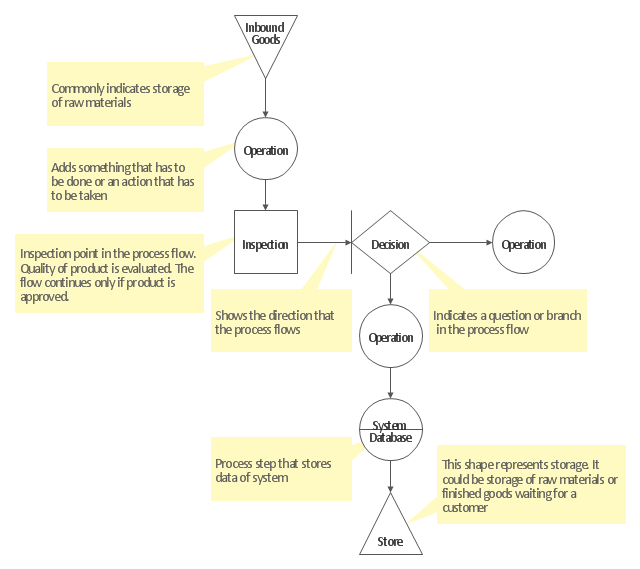
Pictures, symbols or text coupled with lines, arrows on lines show direction of flow. Enables modelling of processes; problems/ opportunities and decision points etc. Develops a common understanding of a process by those involved. No particular standardisation of symbology, so communication to a different audience may require considerable time and explanation." [ifm.eng.cam.ac.uk/ research/ dstools/ tqm-tools/ ]
The TQM diagram template for the ConceptDraw PRO diagramming and vector drawing software is included in the Total Quality Management (TQM) Diagrams solution from the Quality area of ConceptDraw Solution Park.
TQM flowchart template
- UML Diagram | Entity Relationship Diagram Symbols | Diagramming ...
- TQM diagrams - Vector stencils library | TQM diagram - Template ...
- Block Diagram | Storage area networks (SAN). Computer and ...
- Server hardware - Rack diagram | UML component diagram - Start ...
- Software Diagrams | Software and Database Design with ...
- Data Flow Diagrams | Data structure diagram with ConceptDraw ...
- AWS Database - Vector stencils library | Design elements - AWS ...
- Software and Database Design with ConceptDraw PRO | Database ...
- AWS Architecture Diagrams | AWS Simple Icons for Architecture ...
- How to Create an Azure Architecture Diagram Using ConceptDraw ...
- Library Database System Diagram 0
- Entity Relationship Diagram Examples | Local area network (LAN ...
- Data Flow Diagrams | Entity Relationship Diagram Examples | Data ...
- Microsoft Azure | Azure Architecture | Microsoft Azure network and ...
- Microsoft Azure | Azure Storage | Workitems workflow diagram ...
- Data Flow Diagram Symbols. DFD Library | Basic Flowchart ...
- Data flow Model Diagram
- DFD Library System | Data Flow Diagrams | Example of DFD for ...
- Azure Storage | Amazon Web Services | Basic Flowchart Symbols ...
- TQM diagram - Template