This double bar chart sample shows the nitrate concentration in milligrams per liter in Community Water Systems (CWS), mean and maximum by year, in New Mexico in 1999-2015. It was drawn using data from the New Mexico's Indicator-Based Information System (NM-IBIS) website. [ibis.health.state.nm.us/ indicator/ complete_ profile/ CommWaterNitrates.html]
"Nitrate toxicity is a preventable cause of methemoglobinemia (blue baby syndrome), especially in infants. Infants younger than 4 months of age are at greatest risk of toxicity from nitrate-contaminated drinking water.
These infants are more susceptible to developing methemoglobinemia because the pH of their gut is normally higher (less acidic) than in older children and adults. The higher pH enhances the conversion of ingested nitrate to the more toxic nitrite. The bacterial flora of a young infant's gut is also different from that found in older children and adults and might be more likely to convert ingested nitrate to nitrite. Gastroenteritis can increase body transformation of nitrate to nitrite and absorption into the bloodstream of nitrite from the large intestine.
A large proportion of hemoglobin in young infants is in the form of fetal hemoglobin. Fetal hemoglobin is more readily oxidized to methemoglobin (MHg) by nitrites than is adult hemoglobin. In addition, in infants, the enzyme (NADH-dependent methemoglobin reductase) responsible for reduction of formed MHg back to normal hemoglobin has only about half the activity it has in adults.
Symptoms such as shortness of breath and bluish skin coloring around the mouth, hands, or feet, can occur in infants rapidly over a period of days. If the condition is severe, it could lead to convulsions, coma, and even death, if untreated. Most older children and adults can take in larger amounts of nitrate without experiencing the same health effects as infants. However, pregnant women, nursing mothers, and people with low stomach acid conditions or those deficient in an enzyme that changes MHg back to normal hemoglobin are more susceptible to nitrate-induced methemoglobinemia and could be affected by water with nitrate levels above 10 mg/ L.
Adverse reproductive outcomes such as spontaneous abortions, intrauterine growth retardation, and various birth defects such as anencephaly have been reported in scientific literature from exposure to high nitrate levels in drinking water; however, the evidence is inconsistent.
Little is known about possible health effects from high nitrate level exposure over a long period of time. However, some studies suggest that there might be a risk of stomach, esophageal or bladder cancers in people with prolonged ingestion of high levels of nitrate. This might be due to the formation of nitrosoamines in the body following ingestion exposure to high levels of nitrate.
International Agency for Research on Cancer (IARC) classified ingested nitrate or nitrite as probably carcinogenic to humans (Group 2A) under conditions that result in formation of nitroso-compounds (e.g., nitrosoamines) in the body (endogenous nitrosation)." [ibis.health.state.nm.us/ indicator/ view/ CommWaterNitrates.MeanMax.Year.html]
The column chart example "Nitrate concentration in Community Water Systems (CWS)" was created using the ConceptDraw PRO diagramming and vector drawing software extended with the Bar Graphs solution from the Graphs and Charts area of ConceptDraw Solution Park.
Double bar graph
.png--diagram-flowchart-example.png)
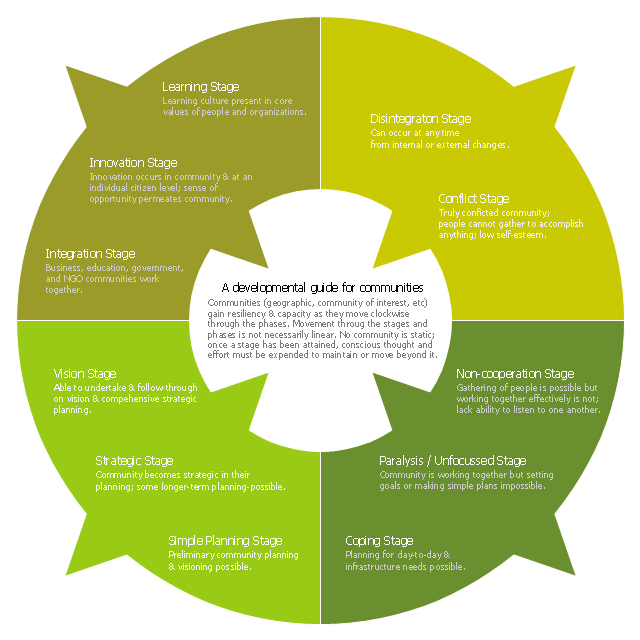
This ring chart sample was created on the base of the figure illustrating the "CCP Handbook - Comprehensive Community Planning for First Nations in British Columbia" from the Government of Canada website. "Tool 1: Centre for Innovative & Entrepreneurial Leadership (CIEL) Community Life Cycle Matrix.
Actualization Phase.
Community is highly developed and encourages learning & innovation while respecting history and culture. Community shares resources with others and regularly monitors itself, continuing to enhance capacity.
Action: Community undertakes regular reviews and reflection activities to maintain or enhance stage / phase.
Pre-Community or Chaos Phase.
Community is undeveloped. Limited sharing of resources or recognition of value of a community.
Action: Community can (re)form through the identification of and action of influential and respected leaders (elected or unelected).
Vision Phase.
Community recognizes the importance of vision and long-term planning; is able to move in this direction.
Action: Community can engage in planning, meaningful consultation of its members, & working towards the development of strategic thinking & planning, and, ultimately, identifying community-wide values, distinct community characteristics and a vision.
Emergence Phase.
Community exists but has significant problems, making anything but survival & fulfilling short-term needs impossible.
Action: Community can advance through focus on small, non-political, trustbuilding projects to build success, respect, confidence, relationships & skills.
Why the Matrix.
The challenge of developing innovative and entrepreneurial communities is in ensuring that the communities have a clear picture of where they are at and where they want to go. This enables a better match of the tools available with both the capacity of the community and the hoped for goal. For example, while strategic planning may work for some communities, the planning process may also lead to frustration and failure in other communities that do not have the necessary trust, social capital or capacity." [aadnc-aandc.gc.ca/ eng/ 1100100021972/ 1100100022090]
The ring chart example "Community life cycle matrix" was created using the ConceptDraw PRO diagramming and vector drawing software extended with the Target and Circular Diagrams solution from the Marketing area of ConceptDraw Solution Park.
www.conceptdraw.com/ solution-park/ marketing-target-and-circular-diagrams
Ring chart
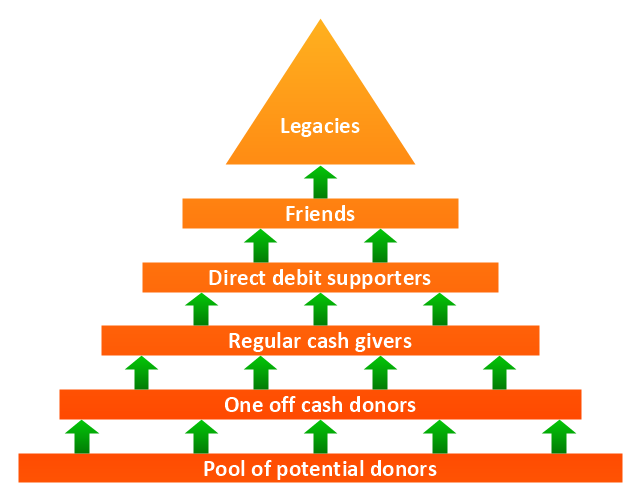
"Fundraising or fund raising (also development) is the process of soliciting and gathering voluntary contributions of money or other resources, by requesting donations from individuals, businesses, charitable foundations, or governmental agencies. Traditionally, fundraising consisted mostly of asking for donations on the street or at people's doors, and this is experiencing very strong growth in the form of face-to-face fundraising, but new forms of fundraising such as online fundraising have emerged in recent years, though these are often based on older methods such as grassroots fundraising." [Fundraising. Wikipedia]
The example "Fundraising pyramid diagram for community based cash donors" was redesigned using the ConceptDraw PRO diagramming and vector drawing software from Commons Wikimedia file Fundraising pyramid for community based cash donors.jpg. [commons.wikimedia.org/ wiki/ File:Fundraising_ pyramid_ for_ community_ based_ cash_ donors.jpg]
The triangular chart example "Fundraising pyramid diagram for community based cash donors" is included in the Pyramid Diagrams solution from the Marketing area of ConceptDraw Solution Park.
Pyramid diagram
This area chart sample shows the US federal prisoner population changes from 1914 to 2010.
"The Federal Bureau of Prisons (BOP) is a United States federal law enforcement agency. A subdivision of the U.S. Department of Justice, the Bureau is responsible for the administration of the federal prison system. The system also handles prisoners who committed acts considered felonies under the District of Columbia's law. The Bureau was established in 1930 to provide more progressive and humane care for federal inmates, to professionalize the prison service, and to ensure consistent and centralized administration of the 11 federal prisons in operation at the time.
According to its official web site, the Bureau consists of more than 116 institutions, six regional offices, its headquarters office in Washington, D.C., two staff training centers, and 22 community corrections offices, and is responsible for the custody and care of approximately 210,000 federal offenders. Approximately 82 percent of these inmates are confined in Bureau-operated correctional facilities or detention centers. The remainder are confined through agreements with state and local governments or through contracts with privately operated community corrections centers, detention centers, prisons, and juvenile facilities." [Federal Bureau of Prisons. Wikipedia]
This area graph sample was redesigned from the Wikimedia Commons file: Federal timeline US prisoners.gif. [commons.wikimedia.org/ wiki/ File:Federal_ timeline_ US_ prisoners.gif]
The area chart example "Federal timeline US prisoners" was created using the ConceptDraw PRO diagramming and vector drawing software extended with the Area Charts solution from the Graphs and Charts area of ConceptDraw Solution Park.
Area graph

 Bar Graphs
The Bar Graphs solution enhances ConceptDraw PRO v10 functionality with templates, numerous professional-looking samples, and a library of vector stencils for drawing different types of Bar Graphs, such as Simple Bar Graph, Double Bar Graph, Divided Bar Graph, Horizontal Bar Graph, Vertical Bar Graph, and Column Bar Chart.
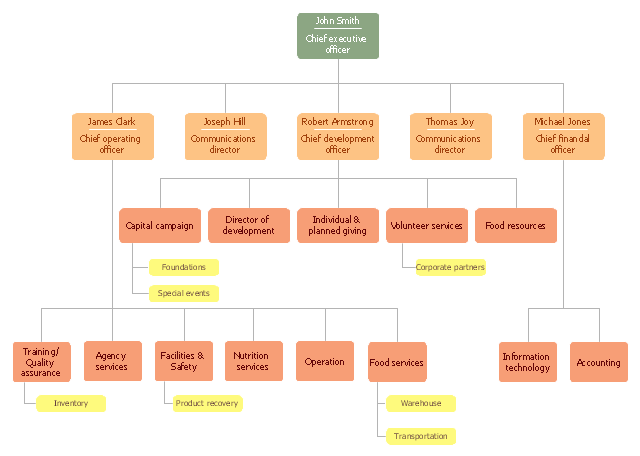
"A food bank or foodbank is a non-profit, charitable organization that distributes food to those who have difficulty purchasing enough food to avoid hunger.
In the United States and Australia, food banks usually operate on the "warehouse" model. They act as food storage and distribution depots for smaller front line agencies; and usually do not themselves give out food directly to the hungry. After the food is collected, sorted, and reviewed for quality, these food banks distribute it to non-profit community or government agencies, including food pantries, food closets, soup kitchens, homeless shelters, orphanages, and schools.
Outside North America and Australia, the "front line" model is often found. Such food banks give out most or all of their food directly to the end users. For both models, the largest sources of food include for-profit growers, manufacturers, distributors and retailers who in the normal course of business have excess food that they cannot sell. Some foodbanks receive a substantial proportion of their food from individual donors, including their volunteer workers. There is considerable overlap with food salvage, food rescue and gleaning, although not with freeganism or dumpster-diving." [Food bank. Wikipedia]
The organization chart example "Foodbank" was created using the ConceptDraw PRO diagramming and vector drawing software extended with the Organizational Charts solution from the Management area of ConceptDraw Solution Park.
Organizational chart
 Target and Circular Diagrams
This solution extends ConceptDraw PRO software with samples, templates and library of design elements for drawing the Target and Circular Diagrams.
- Circle-Spoke Diagrams | Organizational Charts | Community life ...
- Community life cycle matrix - Ring chart | How to Present a Social ...
- Double bar chart - Nitrate concentration in Community Water ...
- Bar Chart Examples | Bar Graphs | Nitrate concentration in ...
- Competitor Analysis | Property Management Examples | Community ...
- Community life cycle matrix - Ring chart | Basic Diagramming | Use ...
- Diagram Of A Community Chart
- Double bar graph - Template | Bar Chart Software | Nitrate ...
- Changes in price indices - Double bar chart | Nitrate concentration in ...
- Chart Of Life Cycle
- Pie Chart Examples and Templates | Chart Examples | Donut Chart ...
- Double bar chart - Nitrate concentration in Community Water ...
- How to Draw a Line Chart Quickly | Network Community Structure ...
- Show The Chart Of Management Of Community Life
- How to Draw a Matrix Organizational Chart with ConceptDraw PRO ...
- Bar Graphs | Chart Examples | Cliparts For Community Resource ...
- Double bar graph - Template | Bar Graphs | Nitrate concentration in ...
- Network Topologies | Network Glossary Definition | Pyramid Chart ...
- Community life cycle matrix - Ring chart
- Competitive feature comparison matrix chart