"In software engineering, a class diagram in the Unified Modeling Language (UML) is a type of static structure diagram that describes the structure of a system by showing the system's classes, their attributes, operations (or methods), and the relationships among objects. ...
The class diagram is the main building block of object oriented modelling. It is used both for general conceptual modelling of the systematics of the application, and for detailed modelling translating the models into programming code. Class diagrams can also be used for data modeling. The classes in a class diagram represent both the main objects, interactions in the application and the classes to be programmed." [Class diagram. Wikipedia]
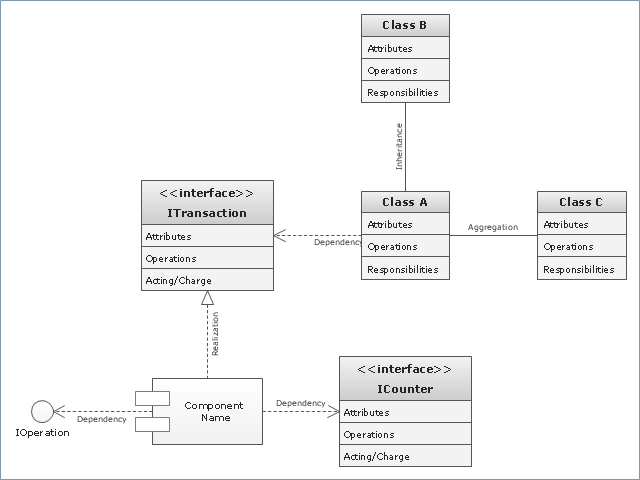
The template "UML class diagram" for the ConceptDraw PRO diagramming and vector drawing software is included in the Rapid UML solution from the Software Development area of ConceptDraw Solution Park.
www.conceptdraw.com/ solution-park/ software-uml
The class diagram is the main building block of object oriented modelling. It is used both for general conceptual modelling of the systematics of the application, and for detailed modelling translating the models into programming code. Class diagrams can also be used for data modeling. The classes in a class diagram represent both the main objects, interactions in the application and the classes to be programmed." [Class diagram. Wikipedia]
The template "UML class diagram" for the ConceptDraw PRO diagramming and vector drawing software is included in the Rapid UML solution from the Software Development area of ConceptDraw Solution Park.
www.conceptdraw.com/ solution-park/ software-uml
UML class diagram
Software development with ConceptDraw DIAGRAM

 Event-driven Process Chain Diagrams
Event-Driven Process Chain Diagrams solution extends ConceptDraw DIAGRAM functionality with event driven process chain templates, samples of EPC engineering and modeling the business processes, and a vector shape library for drawing the EPC diagrams and EPC flowcharts of any complexity. It is one of EPC IT solutions that assist the marketing experts, business specialists, engineers, educators and researchers in resources planning and improving the business processes using the EPC flowchart or EPC diagram. Use the EPC solutions tools to construct the chain of events and functions, to illustrate the structure of a business process control flow, to describe people and tasks for execution the business processes, to identify the inefficient businesses processes and measures required to make them efficient.
 Fault Tree Analysis Diagrams
This solution extends ConceptDraw DIAGRAM.5 or later with templates, fault tree analysis example, samples and a library of vector design elements for drawing FTA diagrams (or negative analytical trees), cause and effect diagrams and fault tree diagrams.
- Entity-Relationship Diagram (ERD) | UML Notation | Data flow ...
- UML Activity Diagram | Diagramming Software for Design UML ...
- Class Diagram Uml Template
- Invoice payment process - Flowchart | UML activity diagram ...
- UML Class Diagram Example - Social Networking Site | UML Class ...
- UML Deployment Diagram. Design Elements | Design elements ...
- UML activity diagram - Cash withdrawal from ATM | UML Activity ...
- UML Class Diagram Notation
- Genralization And Inheritance In Uml Ppt
- Class Diagram Tool | UML Class Diagram Generalization Example ...
- Design elements - Alarm and access control | UML activity diagram ...
- UML Diagram
- Remote Learning Sessions - Webinars | Business Process Elements ...
- Rapid UML | PM Personal Time Management | ConceptDraw ...
- UML Class Diagrams
- UML activity diagram - Cash withdrawal from ATM | UML Tool ...
- UML Activity Diagram
- UML Notation | UML Class Diagrams. Diagramming Software for ...
- Accounting Flowcharts | Accounting Flowcharts | Event-driven ...
- Applications | Event-driven Process Chain Diagrams EPC | UML ...