The vector stencils library "Sales dashboard" contains 27 charts and graphic indicators.
Use it for drawing sales dashboards in the ConceptDraw PRO diagramming and vector drawing software extended with the Sales Dashboard solution from the Marketing area of ConceptDraw Solution Park.
Use it for drawing sales dashboards in the ConceptDraw PRO diagramming and vector drawing software extended with the Sales Dashboard solution from the Marketing area of ConceptDraw Solution Park.
Column Chart

Bar Chart

Line Chart

Divided Bar

Pie Chart

Two Bubbles Indicator

Speedometer Gauge 1

Speedometer Gauge 2

Speedometer Gauge 3

Speedometer Gauge 4

Slider Horizontal 1

Slider Horizontal 2

Slider Horizontal 3

Slider Horizontal 4

Slider Horizontal 5

Slider Horizontal 6

Slider Horizontal 7

Slider Vertical 1

Slider Vertical 2

Slider Vertical 3

Bullet 1

Bullet 2

Bullet 3

Bullet 4

Backgroung 1

Backgroung 2

Backgroung 3

 Composition Dashboard
Composition dashboard solution extends ConceptDraw PRO software with templates, samples and vector stencils library with charts and indicators for drawing visual dashboards showing data composition.
HelpDesk
How to Connect Text Data to a Time Series Chart on Your Live Dashboard


This example visual dashboard example shows website traffic metrics. Divided bar chart and pie chart are used to visualize compositional data. Scatter plot is used to visually analyse correlation between two data sets.
"Web traffic is the amount of data sent and received by visitors to a web site. ...
This is determined by the number of visitors and the number of pages they visit. Sites monitor the incoming and outgoing traffic to see which parts or pages of their site are popular and if there are any apparent trends, such as one specific page being viewed mostly by people in a particular country. There are many ways to monitor this traffic and the gathered data is used to help structure sites, highlight security problems or indicate a potential lack of bandwidth not all web traffic is welcome. Some companies offer advertising schemes that, in return for increased web traffic (visitors), pay for screen space on the site. Sites also often aim to increase their web traffic through inclusion on search engines and through search engine optimization." [Web traffic. Wikipedia]
The example "Website traffic dashboard" was created using the ConceptDraw PRO diagramming and vector drawing software extended with the Corellation Dashboard solution from the area "What is a Dashboard" of ConceptDraw Solution Park.
Visual dashboard

 Comparison Dashboard
Comparison dashboard solution extends ConceptDraw PRO software with samples, templates and vector stencils library with charts and indicators for drawing the visual dashboard comparing data.
This projects HR dashboard example includes the histogram of employees distribution by salary, the area chart of salari distribution, and two horizontal bar charts: "Employees by Project Teams" and "Payroll Breakdown".
"Project Portfolio Management (PPM) is the centralized management of processes, methods, and technologies used by project managers and project management offices (PMOs) to analyze and collectively manage a group of current or proposed projects based on numerous key characteristics. The objectives of PPM are to determine the optimal resource mix for delivery and to schedule activities to best achieve an organization’s operational and financial goals ― while honouring constraints imposed by customers, strategic objectives, or external real-world factors. ... With PPM, the Office of Finance can improve their accuracy for estimating and managing the financial resources of a project or group of projects. In addition, the value of projects can be demonstrated in relation to the strategic objectives and priorities of the organization through financial controls and to assess progress through earned value and other project financial techniques." [Project portfolio management. Wikipedia]
The example "Projects HR dashboard" was created using the ConceptDraw PRO diagramming and vector drawing software extended with the Frequency Distribution Dashboard solution from the area "What is a Dashboard" of ConceptDraw Solution Park.
Visual dashboard

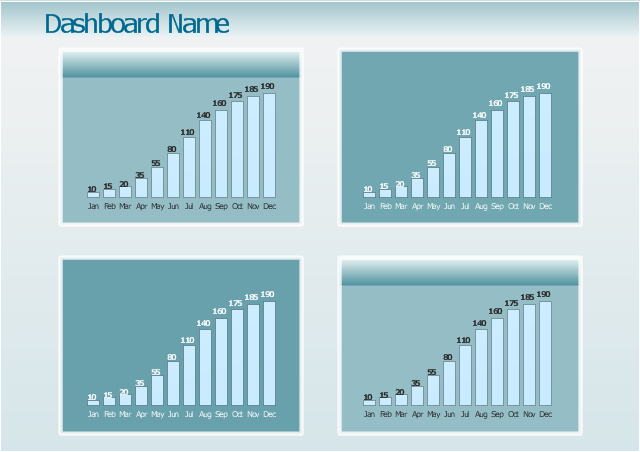
This dashboard template consist of 4 column charts. All these column charts are Live Objects displaying the data from the external source files. Use it to create your business performance management dashboard showing 4 time series of your metrics.
The business performance dashboard template "Time series digital dashboard" for the ConceptDraw PRO diagramming and vector drawing software is included in the Time Series Dashboard solution from the area "What is a Dashboard" of ConceptDraw Solution Park.
The business performance dashboard template "Time series digital dashboard" for the ConceptDraw PRO diagramming and vector drawing software is included in the Time Series Dashboard solution from the area "What is a Dashboard" of ConceptDraw Solution Park.
Time series digital dashboard - Template
 Business Intelligence Dashboard
Business Intelligence Dashboard solution extends the ConceptDraw PRO v11 functionality with exclusive tools, numerous ready-to-use vector objects, samples and quick-start templates for creation professional Business Intelligence Dashboards, Business Intelligence Graphics, Business Intelligence Charts and Maps of different kinds. Design easy the BI dashboard, BI model or Dynamic chart in ConceptDraw PRO to monitor the company's work, to track the indicators corresponding your company's data, to display and analyze key performance indicators, to evaluate the trends and regularities of the processes occurring at the company.
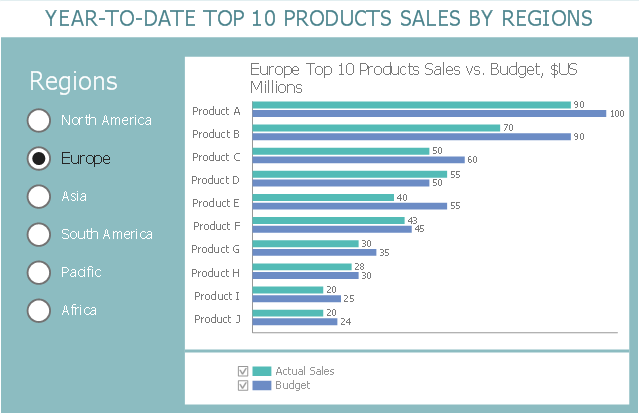
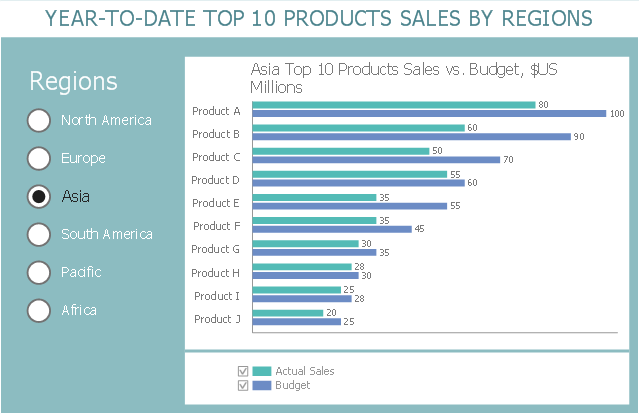
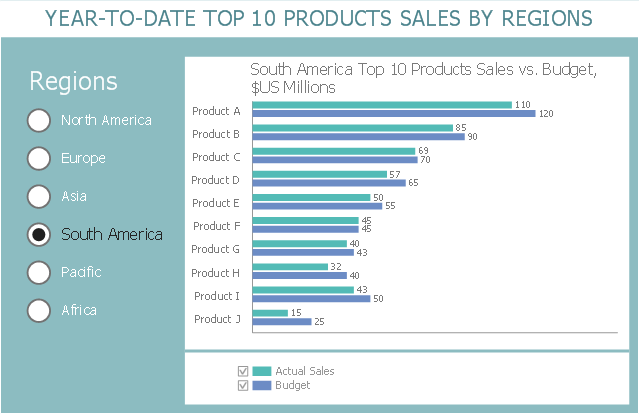
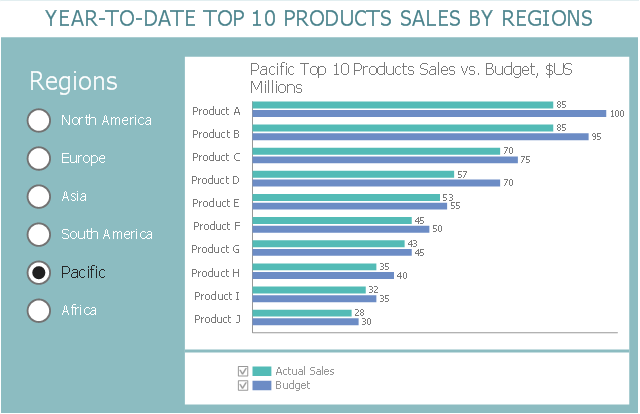
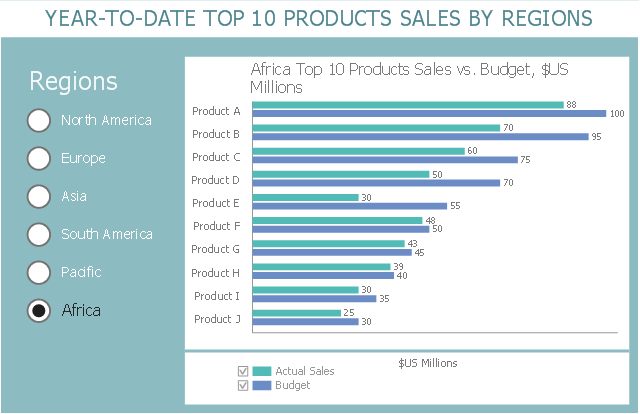
This business intelligence dashboard sample shows the year-to-date top 10 products sales by regions using horizontal bar charts.
"Dashboards often provide at-a-glance views of KPIs (key performance indicators) relevant to a particular objective or business process (e.g. sales, marketing, human resources, or production). In real-world terms, "dashboard" is another name for "progress report" or "report."" [Dashboard (business). Wikipedia]
The BI dashboard example "Year-to-date Top 10 Products Sales by Regions" was created using ConceptDraw PRO software extended with the Business Intelligence Dashboards solution from the Business Processes area of ConceptDraw Solution Park.
North America

Europe
Asia
South America
Pacific
Africa
 Time Series Dashboard
Time series dashboard solution extends ConceptDraw PRO software with templates, samples and vector stencils libraries with charts, graphs and plots for drawing the visual dashboards showing data time series.
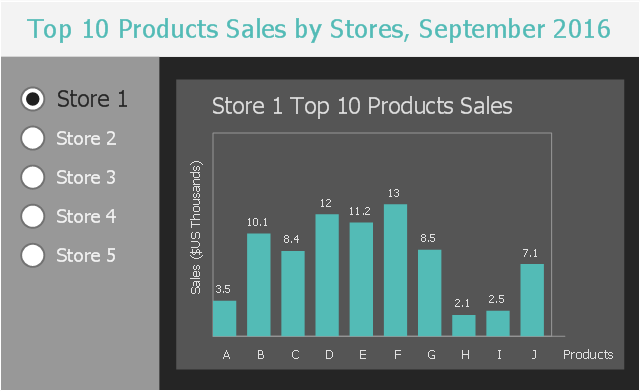
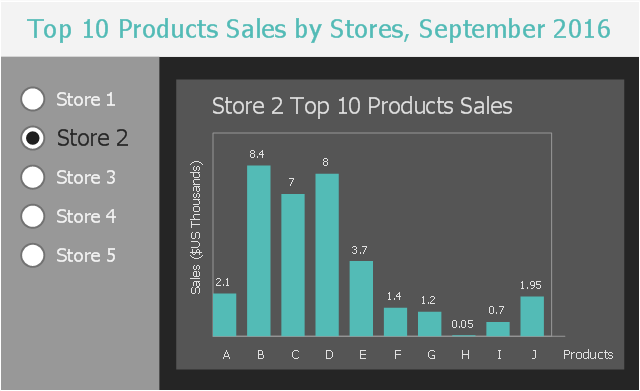
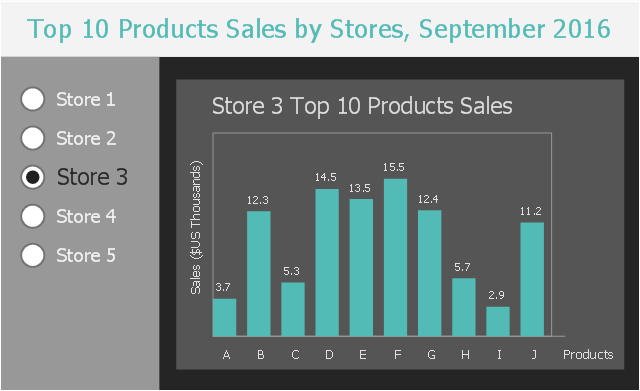
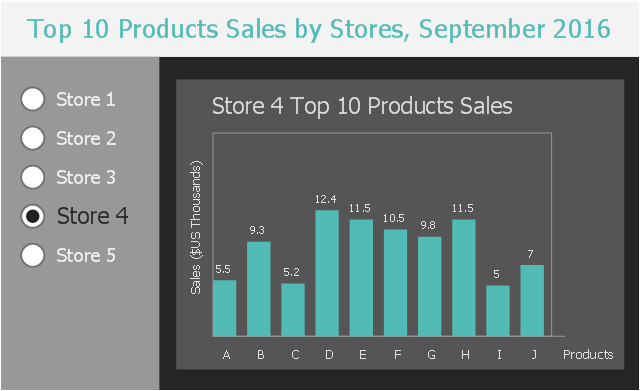
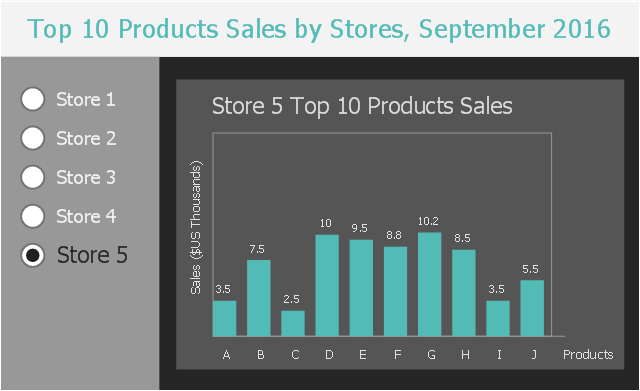
This business intelligence dashboard sample shows the top 10 products sales by stores in September, 2016 using vertical bar charts.
"Bar graphs/ charts provide a visual presentation of categorical data. Categorical data is a grouping of data into discrete groups, such as months of the year, age group, shoe sizes, and animals. These categories are usually qualitative. In a column bar chart, the categories appear along the horizontal axis; the height of the bar corresponds to the value of each category." [Bar chart. Wikipedia]
The BI dashboard example "Top 10 Products Sales by Stores, September 2016" was created using ConceptDraw PRO software extended with the Business Intelligence Dashboards solution from the Business Processes area of ConceptDraw Solution Park.
Store 1
Store 2
Store 3
Store 4
Store 5
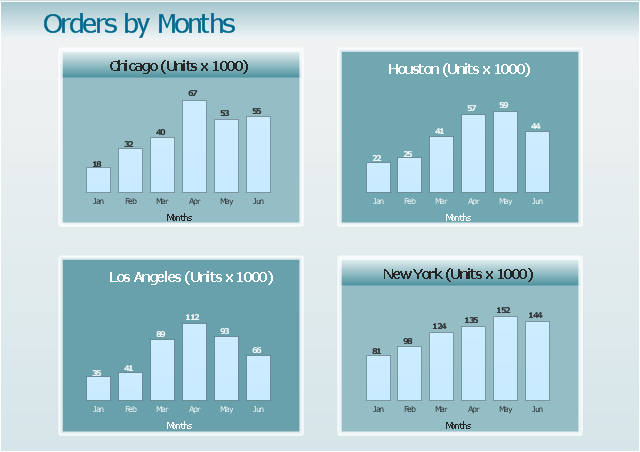
"A time series is a sequence of data points, measured typically at successive points in time spaced at uniform time intervals. ... Time series are very frequently plotted via line charts. Time series are used in statistics, signal processing, pattern recognition, econometrics, mathematical finance, weather forecasting, earthquake prediction, electroencephalography, control engineering, astronomy, and communications engineering.
Time series analysis comprises methods for analyzing time series data in order to extract meaningful statistics and other characteristics of the data. Time series forecasting is the use of a model to predict future values based on previously observed values." [Time series. Wikipedia]
The example "Orders by months - Time series dashboard" was created using the ConceptDraw PRO diagramming and vector drawing software extended with the Time Series Dashboard solution from the area "What is a Dashboard" of ConceptDraw Solution Park.
Order by months - Time series dashboard
HelpDesk
How to Create a Sales Dashboard Using ConceptDraw PRO

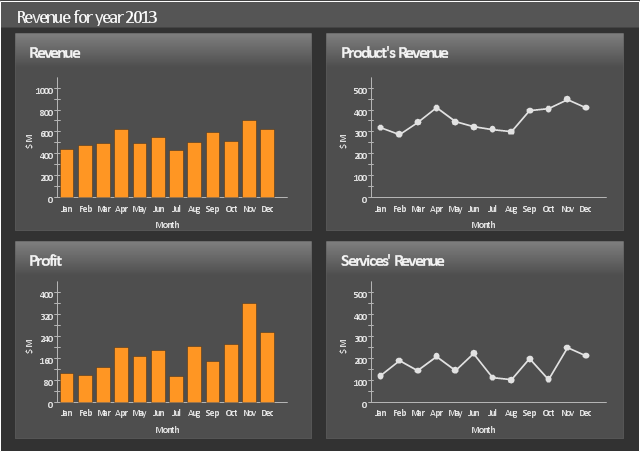
This sales dashboard sample shows how key performance parameters such as revenue, profit, product's revenue and product's profit change in time using bar charts and line graphs.
The dashboard example "Sales revenue" was created using the ConceptDraw PRO diagramming and vector drawing software extended with the Sales Dashboard solution from the Marketing area of ConceptDraw Solution Park.
The dashboard example "Sales revenue" was created using the ConceptDraw PRO diagramming and vector drawing software extended with the Sales Dashboard solution from the Marketing area of ConceptDraw Solution Park.
Sales dashboard
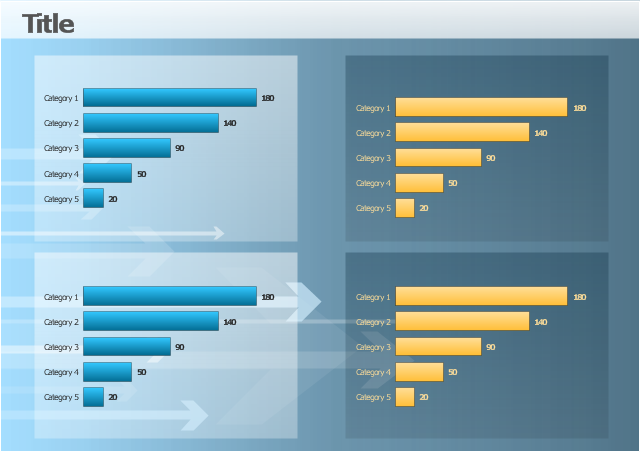
The template "Comparison dashboard" for the ConceptDraw PRO diagramming and vector drawing software is included in the Comparison Dashboard solution from the area "What is a Dashboard" of ConceptDraw Solution Park.
Visual dashboard template
- Barchart Education Dashboard
- Comparative Bar Chart For Dashboard
- Bar Chart Template for Word | Time series digital dashboard ...
- Sales Growth. Bar Graphs Example | Rainfall Bar Chart | Sales ...
- Sales Growth. Bar Graphs Example | Chart Maker for Presentations ...
- Sales Process Flowcharts | Bar Chart Template for Word | Sales ...
- Feature Comparison Chart Software | Comparison Dashboard | Bar ...
- Sales Dashboards for Your Company | How to Create a Bar Chart in ...
- Time Series Dashboard | Design elements - Time series charts ...
- Bar Graphs | Bar chart - Template | Frequency Distribution ...
- How to Create a Bar Chart in ConceptDraw PRO | PM Dashboards ...
- Comparison Dashboard | Design elements - Comparison charts and ...
- Sales dashboard - Vector stencils library | Design elements - Sales ...
- Sales Growth. Bar Graphs Example | Sales Dashboard | Line Graph ...
- Bar Chart Dash
- A Bar Chart And Column Chart Are Equivalent Chart Types In Excel
- Time series charts - Vector stencils library | Bar Diagrams for ...
- Time Series Dashboard | Design elements - Time series charts ...
- Single Bar Chart
- Column Chart Dashboard