HelpDesk
How to Create a Fault Tree Analysis Diagram (FTD) in ConceptDraw PRO
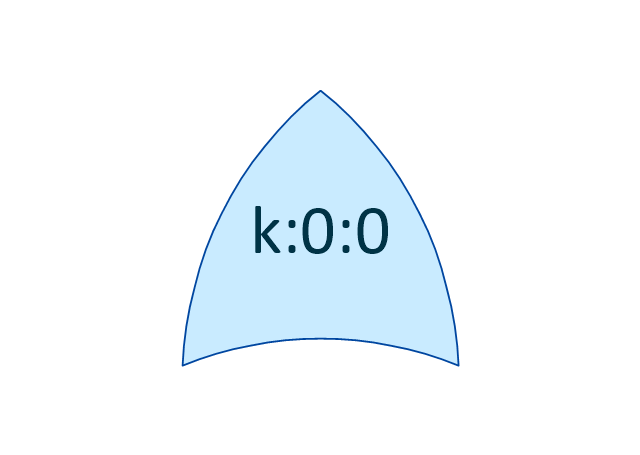
Fault Tree Diagram are logic diagram that shows the state of an entire system in a relationship of the conditions of its elements. Fault Tree Diagram are used to analyze the probability of functional system failures and safety accidents. ConceptDraw PRO allows you to create professional Fault Tree Diagrams using the basic FTD symbols. An FTD visualize a model of the processes within a system that can lead to the unlikely event. A fault tree diagrams are created using standard logic symbols . The basic elements in a fault tree diagram are gates and events.The vector stencils library "Fault tree analysis diagrams" contains 12 symbols for drawing FTA diagrams in the ConceptDraw PRO diagramming and vector drawing software extended with the Fault Tree Analysis Diagrams solution from the Engineering area of ConceptDraw Solution Park.
www.conceptdraw.com/ solution-park/ engineering-fault-tree-analysis-diagrams
www.conceptdraw.com/ solution-park/ engineering-fault-tree-analysis-diagrams
HelpDesk
Accounting Information Systems Flowchart Symbols
Accounting Information system is a combination of software and hardware, as well as organizational support. Information system - it is not only the software and computers with network equipment, but also a list of instructions and standards which can be notated using Accounting information systems flowchart symbols. All information systems can be divided into information retrieval and data processing systems. Data Flow model is a hierarchical model. Each process can be divided into structural components, that depict by corresponding flowchart symbols, showing the accounting information system in communication with the external environment. The major components of accounting information systems flowchart are: entities, processes, data stores, and data flows. The set of standard accounting information flowchart symbols is intended to show the relationships between the system components. ConceptDraw PRO can help to draw clear accounting information system diagrams using special flowchart symbols.- Site Analysis Symbols
- Fault Tree Analysis Diagrams | Audio Speaker Architectural Symbol ...
- Fault Tree Analysis Symbol Meaning
- Electrical Symbols — Logic Gate Diagram | How to Create a Fault ...
- Basic Flowchart Symbols and Meaning | Life cycle analysis - Ring ...
- Fault Tree Analysis Software | Inhibition Symbol On Flowchart
- Fault Tree Analysis Software | Design elements - Biochemistry of ...
- Process Flowchart | Basic Flowchart Symbols and Meaning ...
- How to Create a Fault Tree Analysis Diagram (FTD) in ConceptDraw ...
- Coad/Yourdon's Object-Oriented Analysis model | Data Flow ...
- HR Flowchart Symbols | Event-driven Process Chain Diagrams ...
- Basic Flowchart Symbols and Meaning | How to Create a Fault Tree ...
- Site Analysis Symbol
- Data Analysis Symbol And Meaning
- Visualize Stakeholder Analysis | Gane Sarson Diagram ...
- Process Flowchart | Basic Flowchart Symbols and Meaning ...
- Basic Flowchart Symbols and Meaning | Root cause analysis tree ...
- Basic Flowchart Symbols and Meaning | Structured Systems ...
- Basic Flowchart Symbols and Meaning | Design elements - HR ...
- Data Flow Diagram Symbols . DFD Library | Data Flow Diagram ...

