Travel Infographics Icons
Traveling is the best way to explore the world, it gives pleasure and creates everlasting memories, gives you a fun of adventure. Travel is educational and allows gaining new friends. Most people enjoy new experiences, simply chill, discover a lot of new, interesting, and sometimes bizarrely. But there are some who have the main goal to challenge themselves when traveling in exotic locations. Travel helps you to re-discover or find yourself and get out of stress. Besides, it is helpful in getting new business ideas, initiating innovations, and establishing business relationships.
For many people travel is an all-consuming passion and their whole life is focused on travel. They travel to the most exotic places, sometimes work there and later go to another place. A lot of these people are bloggers and write about their life, countries they travel to, interesting things they see and do there, etc.
Travel enriches the mind, teaches us about humanity, tolerance, and respect for a point of view, way of life, and mindset different from our own. Travel gives us a feeling of freedom, turns our understanding, stimulates transformations and changes. It is the best way to strengthen relationships with loved people, enjoy a lot of time with family and get unbelievable and unique memories together. It is useful to improve and revive relationships.
Since the internet and social media arrived, journeys have changed dramatically. Now, planning a journey most people read articles, reviews, and tips on social media about all things related to their travel, go through photos and videos, explore location information. Only then they make a choice in favor of a certain city or country, hotel, cafe, restaurant, theater, etc. and only then make a reservation, buy tickets. At this, the internet lives and is successful due to the visual component like illustrations, infographics, schematics, images, photos, videos. Infographics are widely used in many industries and also in travel-related services.
Infographics are becoming more and more popular in the travel information industry. You can describe the best time to travel to a certain country, demonstrate its sightseeing, culture, traditions, local cuisine in a form of infographics. You can make an overview of the best sites for booking flights, hotels, car, or other flight-related issues.
Infographics work for a large number of reasons. They are engaging, appealing, improve the overall effectiveness of content for the user. They are easy-to-read and have a logical fashion. Commonly they contain key information without large texts complex for perception. They help create unique content for social media and websites. Infographics can improve your rate for search engines and increase users' satisfaction with the presented content.
Example 1. Travel Infographics Icons for Design
Working in a travel company and having in hand the ConceptDraw DIAGRAM software enhanced with Travel Infographics solution you can easily design unique infographics able to differentiate your company from a variety of travel companies. Depict the hot travel trends, create infographics for tourism-focused projects, make advertising materials for hotels, restaurants, car rental companies. Outline the travel tips and tricks, infographics helping travelers to plan their trips.

Example 2. Travel Infographics - Tourism Product 5 Components
Make infographics to tell your travelers where to taste delicious dishes, indicate the places where they can make the best photos, areas for active tourism, and uncover many more actual issues. Tell about traveling and illustrate your thoughts making your infographics great-looking and visually appealing due to the pre-made travel infographics icons, clipart, pictograms, symbols.

Example 3. Business Travel Infographics - Economic Contribution of Forestry
The travel infographics you see on this page were created in ConceptDraw DIAGRAM software using the Travel Infographics Solution and included pre-made pictograms and clipart. They successfully demonstrate the solution's capabilities and professional results you can achieve. An experienced user spent 10-15 minutes creating each of these samples.
Use the powerful tools of the Travel Infographics Solution for ConceptDraw DIAGRAM software to create your own infographics and diagrams of any complexity fast and easy, and then successfully use them in your work and personal activity.
All source documents are vector graphic documents. They are available for reviewing, modifying, or converting to a variety of formats (PDF file, MS PowerPoint, MS Visio, and many more graphic formats) from the ConceptDraw STORE. The Travel Infographics Solution is available for all ConceptDraw DIAGRAM users.
NINE RELATED HOW TO's:
Program Structure Diagram is a visual representation of a program's organization, showing its components and their relationships.
Picture: Program Structure Diagram
Desbloquee el lenguaje de los diagramas de flujo con nuestra guía de símbolos de diagramas de flujo. 🔸 Todo lo que necesita saber sobre los conceptos básicos del diagrama de flujo, desde ✔️ puntos de decisión hasta ✔️ pasos del proceso, explore el significado detrás de cada símbolo y domine el arte de crear representaciones visuales claras y efectivas de sus procesos.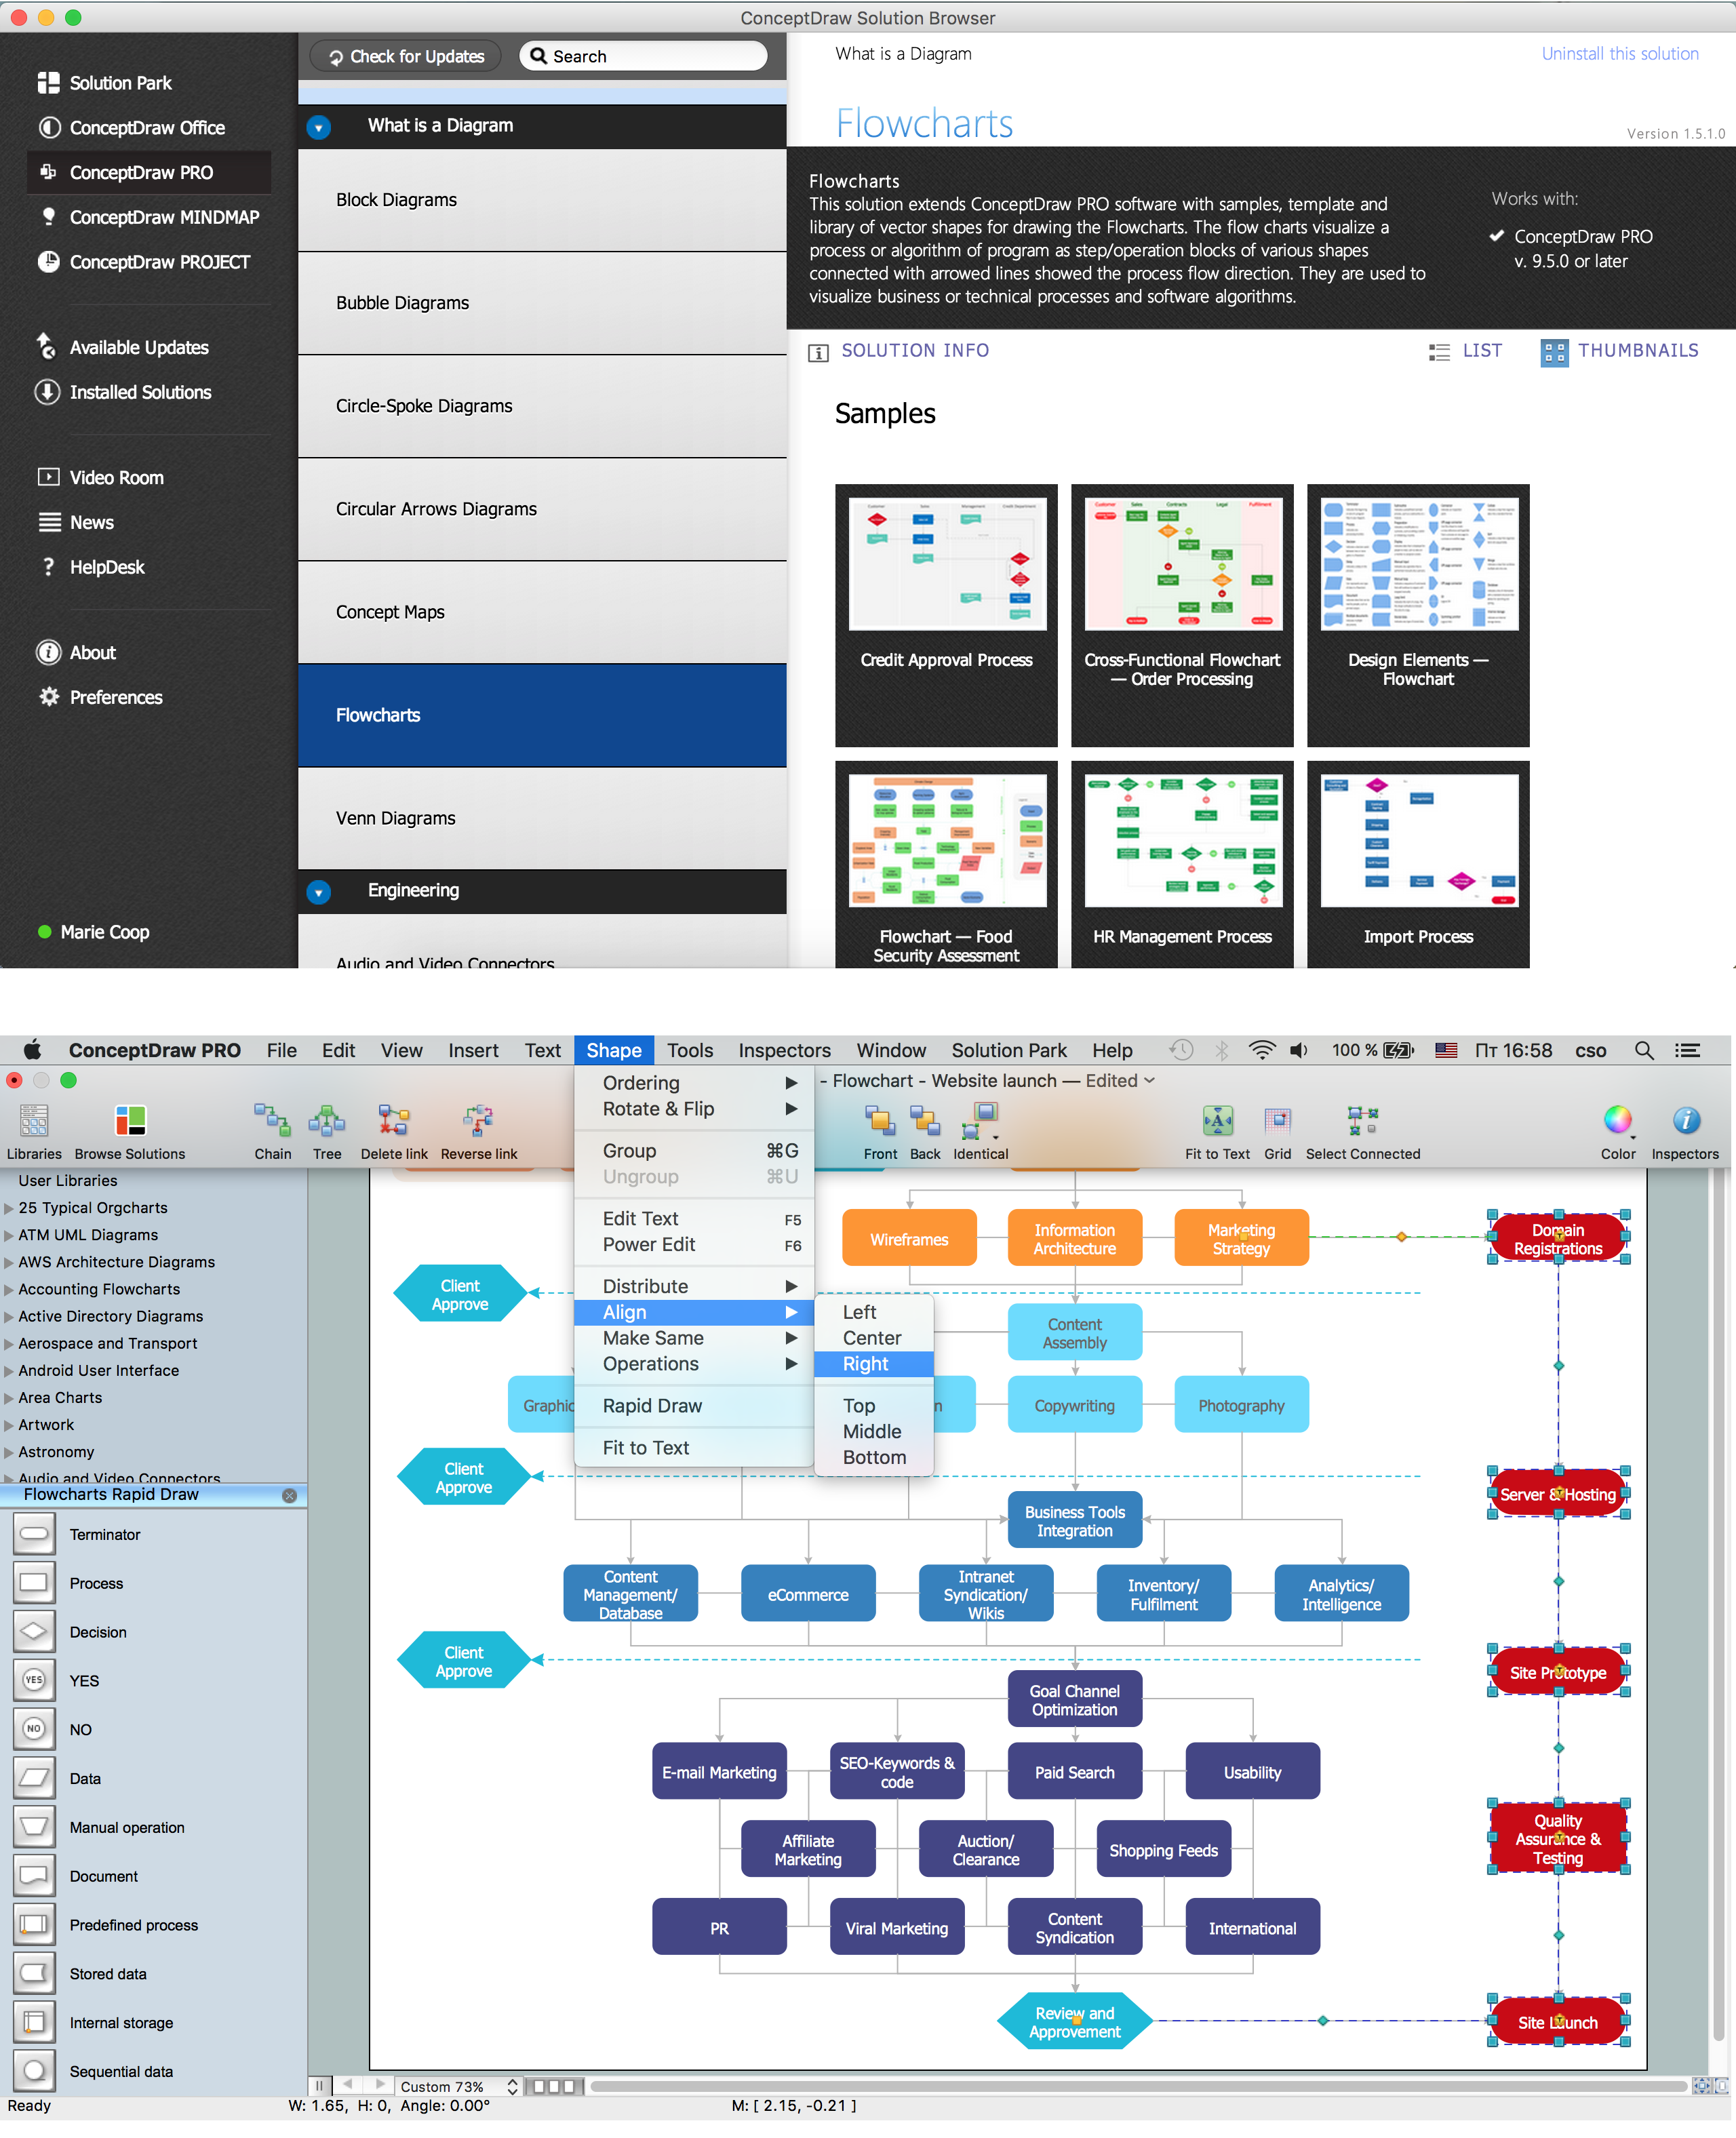
Picture: Symboles Organigramme
Related Solution:
The Accounting flowchart shows how information flows from source documents through the accounting records. The are based on the accounting procedures or processes.
Flowcharts are used to represent accounting information in a system. There are special symbols which are used to create accounting flowcharts. Try conceptdraw flowcharting set of symbols to draw a professional charts.
Picture: Why Flowchart Important to Accounting Information System?
Related Solution:
In ConceptDraw DIAGRAM it really is sp simple to draw even the most complex cross-functional flowcharts. Use the RapidDraw technology and Cross-Functional libraries in ConceptDraw DIAGRAM for the best results.
Picture: How to Simplify Flow Charting — Cross-functional Flowchart
Related Solution:
ConceptDraw DIAGRAM is a software for simplу depicting the business processes based on BPMN 2.0.
Business Process Diagrams Cross-Functional-Flowcharts, Workflows, Process Charts, IDEF0 and IDEF2, Timeline, Calendars, Gantt Charts, Business Process Modeling, Audit and Opportunity Flowcharts and Mind Maps (presentations, meeting agendas).
Picture: Business Process Modeling Notation
Related Solution:
Electronic components have two or more electrical terminals (or leads) aside from antennas which may only have one terminal. These leads connect to create an electronic circuit with a particular function (for example an amplifier, radio receiver, or oscillator). Basic electronic components may be packaged discretely, as arrays or networks of like components, or integrated inside of packages such as semiconductor integrated circuits, hybrid integrated circuits, or thick film devices.
26 libraries of the Electrical Engineering Solution of ConceptDraw DIAGRAM make your electrical diagramming simple, efficient, and effective. You can simply and quickly drop the ready-to-use objects from libraries into your document to create the electrical diagram.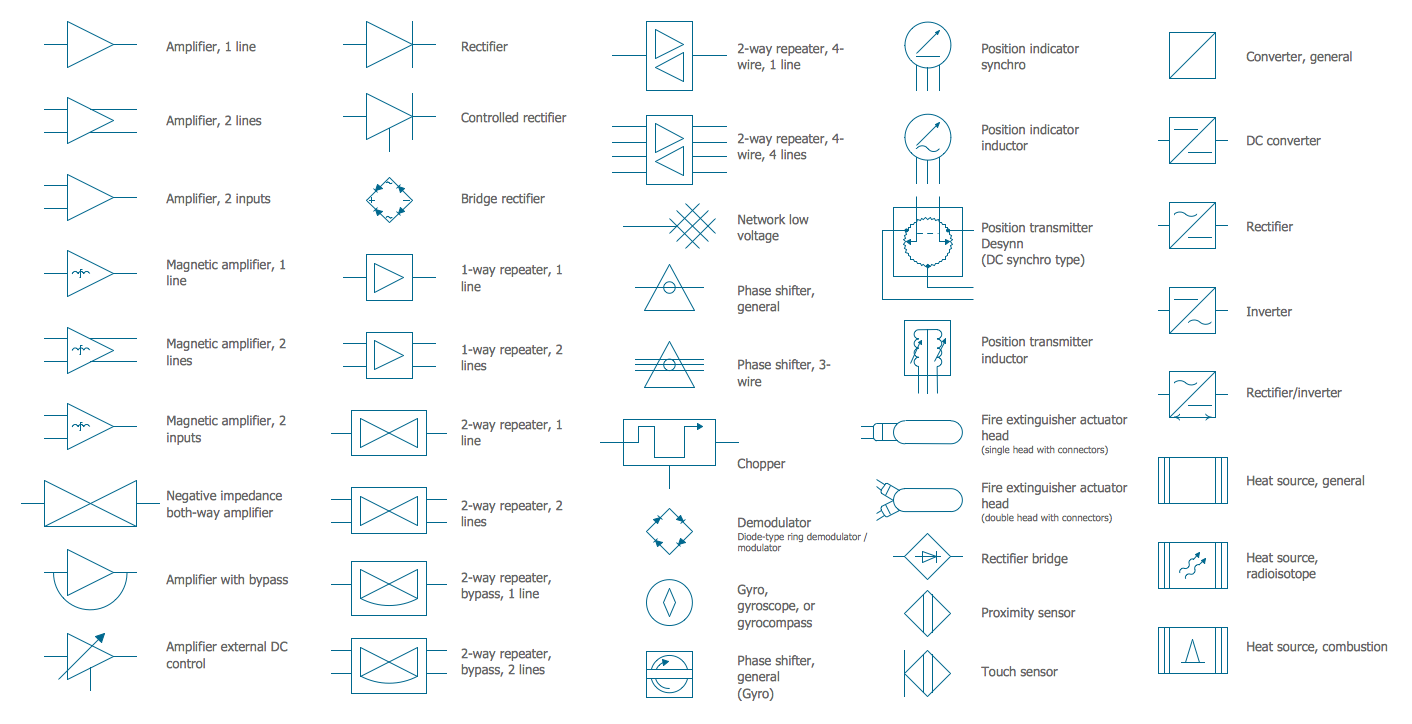
Picture: Electrical Symbols — Composite Assemblies
Related Solution:
There are many tools to manage a process or to illustrate an algorithm or a workflow. Flowcharting is one of those tools. However, it may be difficult to show complex processes that require multiple attributes or several people in a simple flowchart, so a cross-functional flowchart would be a solution for that situation. To create such flowchart, group processes and steps to labeled rows or columns, and divide those groups with horizontal or vertical parallel lines. It is worth mentioning that there are different types of cross-functional flowcharts, like opportunity or deployment flowchart.
This diagram shows a cross-functional flowchart that was made for a trading process. It contains 14 processes, distributed through 5 lines depicting the participants who interact with the process. Also there are connectors that show the data flow of information between processes. The cross-functional flowchart displays a detailed model of the trading process, as well as all participants in the process and how they interact with each other. The lines in the flowchart indicates the position, department and role of the trading process participants.
Picture: Cross-Functional Flowchart
Related Solution:
When talking about engineering, one should define all the terms used, so anybody could understand the topic. Typical network glossary contains definitions of numerous network appliances, types of networks and cable systems. The understanding of basic is crucial for server management, network administration and investigating problems.
The network glossary defines terms related to networking and communications. The most of glossary items has their visual representation in ConceptDraw DIAGRAM libraries of the Computer Network Diagrams solution. This illustration presents a local area network (LAN) diagram. It designed to show the way the interaction of network devices in a local network. The diagram uses a library containing symbols of network equipment, connections and the end-point devices such as network printer, hubs, server, modem and finally computers (PC, mac, laptop). This diagram depicts a physical LAN topology.
Picture: Network Glossary Definition
Related Solution:
It’s very important for any establishment to have a fire exit plan and to train it several times a year. The plan must be put on each floor of the building in a way that it could be easily seen. To make the plan clear and descriptive, you should look through examples and then create one for you your building.
Find out the fire exit plan example created with ConceptDraw DIAGRAM and its Fire and Emergency Plans solution. This plan is a floor plan that shows the ways in which people inside the building can be evacuated in the event of a fire. The location of telephones, fire extinguishers and first aid kits are indicated on the fire exit plan. The Legend in the lower right corner of the plan makes it clear and easy-to-read. Such plan should be placed on the wall on each floor of the building.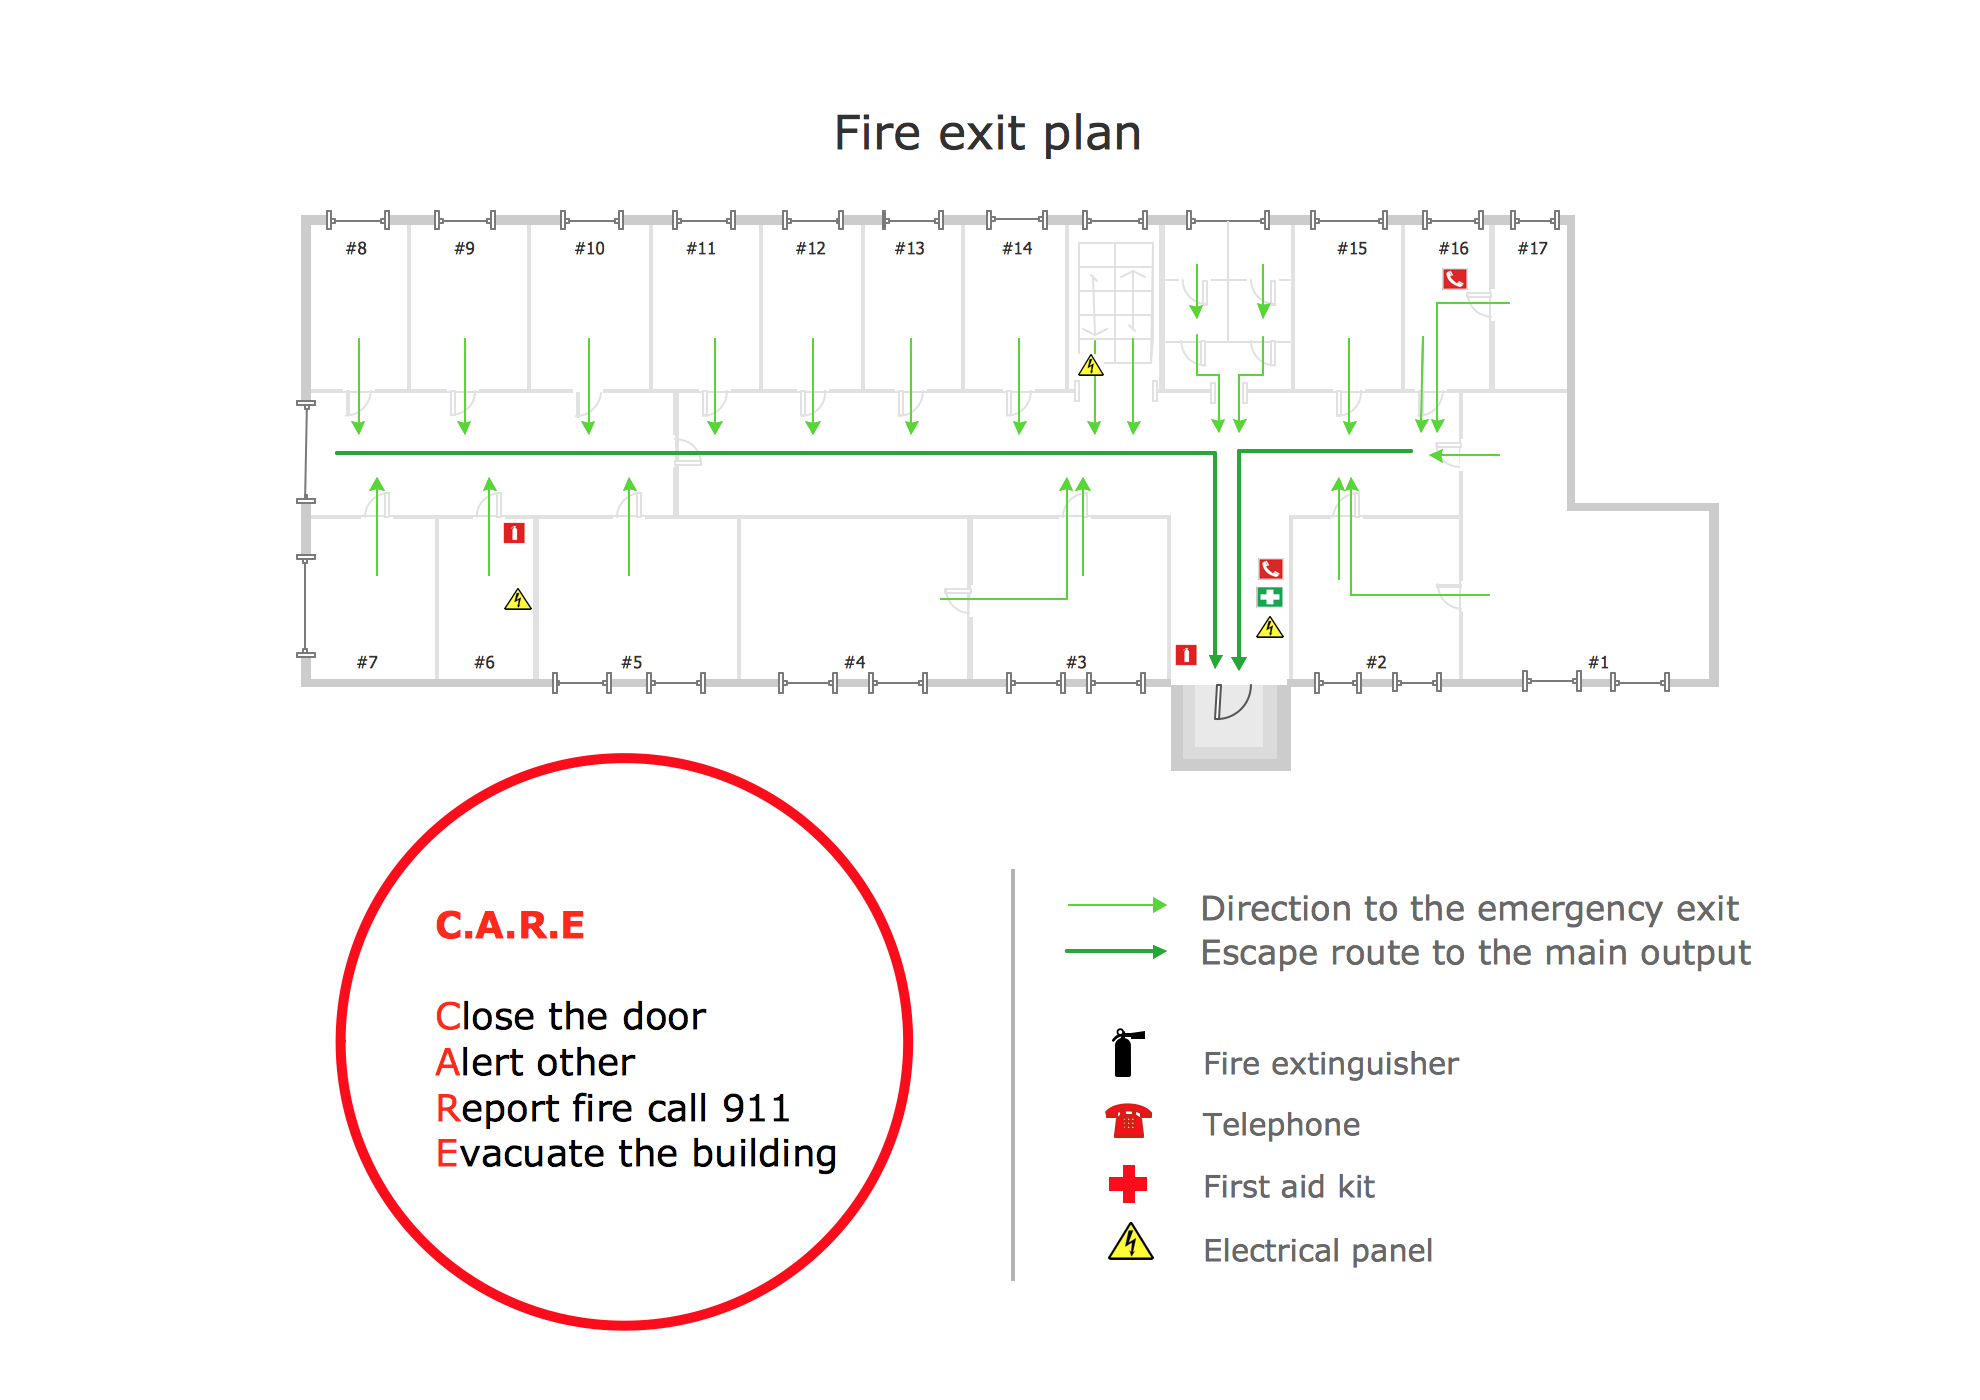
Picture: Fire Exit Plan. Building Plan Examples
Related Solution: