Software for Infographics
An infographic is a visual representation of information. The name originates from two words ‘information’ and ‘graphic’. Infographics are a wonderful and appealing way of presenting information, the main goal of which is to get the audience interested in your information and to make data easily understandable at first glance.
Infographics have a lot of benefits, they are a powerful tool to display complex data and simplify large data sets, numerical information, or statistical data, explain concepts and points of view, show trends, provide new ideas, essential insights, or an interesting project to the audience. They use compelling images to simplify presentations and make them attractive, easier understanding and clear relationships. It is a way to convey data in a compact and shareable form, easier perception of information to be digested at first glance.
Sometimes people have no time to read an entire page of text or get deep in complex spreadsheets, they need precise facts and quick answers to their questions. Therefore infographics are a great choice for them and you to save them as your audience and achieve success and growth of your company, business, or project.
Infographics are so variable that you can use them in a variety of fields and for varied goals, you can focus on any data or problem, show the main processes of a company and the growth, or vice versa focus on the bottlenecks and ways to cope with them. Infographics are a way to create focused and helpful materials, tell the story of success or illustrate case studies, actionable information, and valuable insights. They help to display changes and trends over time and illustrate various components, the distribution of data, and relationships between various values.
The visual format of organizing gathered data is incredibly useful and popular in an abundance of areas. Therefore infographics gained great popularity and currently are used everywhere: in management, marketing, business, advertising, education, statistics, instruction, and many other fields. Infographics outline key points, summary key information and details for readers to speed up the understanding and memorizing. Infographics usually contain colorful and attractive images and clipart, and often include charts, graphs, percentages, timelines, and other graphics for data visualization. Infographics simplify communication and clarify messages. Well-designed infographics expose the business, contribute to its success, efficient promotion in social media, on the web, and in printed materials.
The type of infographic and its content directly depend on your goals and target audience. Statistical infographics often use bar graphs, and pie charts which have great advantages over spreadsheets to visualize and compare data. In any way, the type of content and its structure, graphics, and clipart should be relevant to your specific area and thematic to communicate efficiently to your audience.
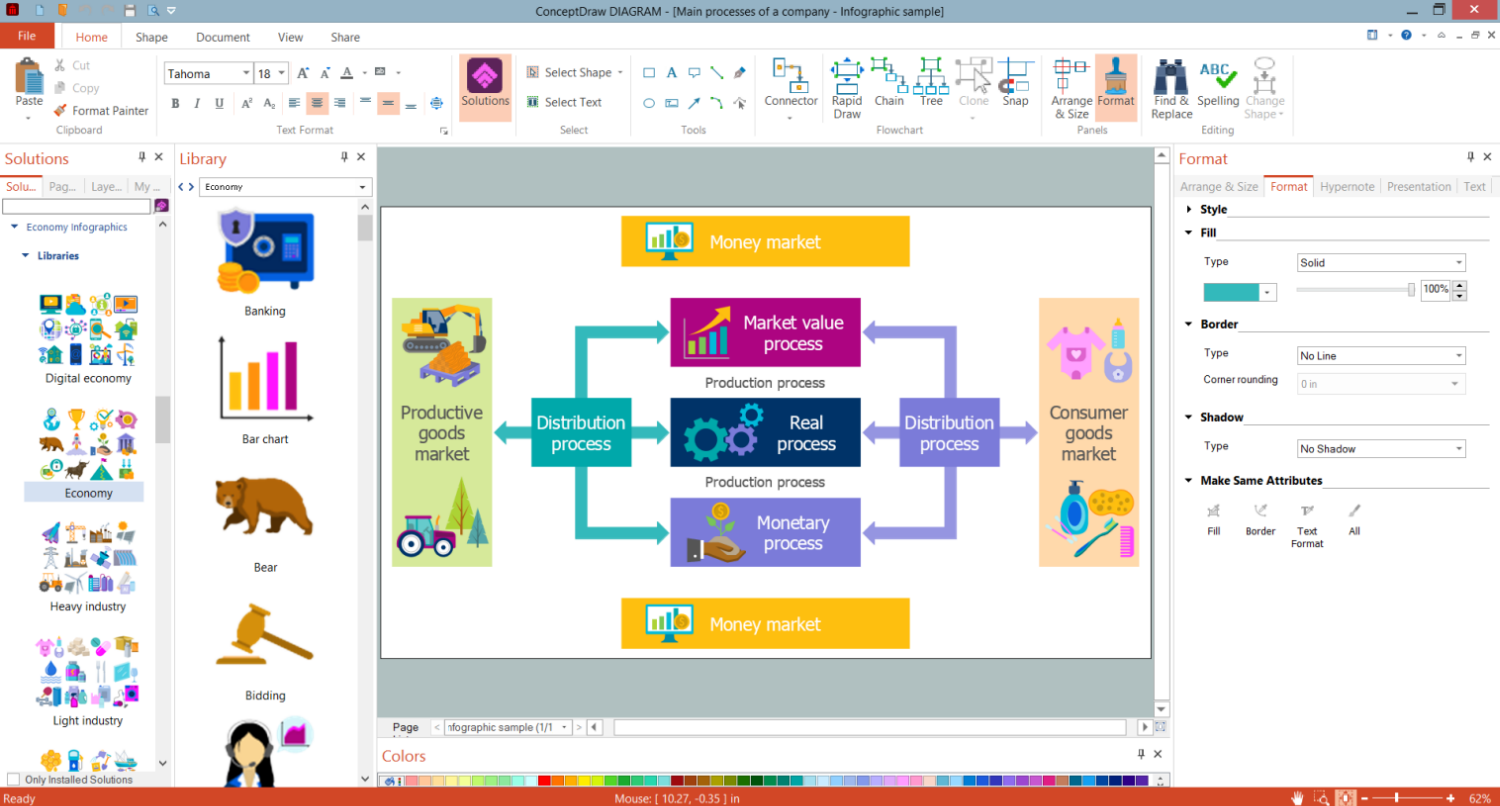
Example 1. ConceptDraw DIAGRAMSoftware for Infographics
Use powerful ConceptDraw DIAGRAM software for infographics with Economy Infographics solution, Marketing Infographics solution, Financial Infographics solution, and a set of other infographics solutions to design beneficial and eye-catching visual infographics without effort. They include attractive visual design elements and a collection of ready-made samples.
Focus on the most important aspects of a particular topic to keep your audience engaged and strive to avoid information overload. It is also recommended to select a coherent color palette for all used graphical elements. Designing interesting and engaging infographics is a way to simplify the communication process and make the information clear to the audience. In addition, attractive infographics are more efficient and reach more people.
To save time, you can customize one of the included infographic samples to fit your goals. The predesigned infographics included in the solution are good samples and a source of inspiration to get an idea of how you want your own infographics to look. You can also embed your brand's emblem or label, use your company's style, or add any other specific information into your infographics to make them unique and indicate your copywriting rights on them.
Once your infographic is designed, you can share it with colleagues, friends, clients, or other viewers by email, save in various graphical formats, and then use it in presentations, posters, print materials, online on websites, or on social media platforms.

Example 2. Economy Infographics Libraries Design Elements
Economy Infographics solution provides 6 libraries of vector design elements:
- Digital Economy
- Economy
- Heavy Industry
- Light Industry
- Raw Materials
- Services

Example 3. Economy Infographics — 7 Ps of Services Marketing
The infographics you see on this page were created in ConceptDraw DIAGRAM software using the Economy Infographics Solution and its pre-made pictograms and clipart. They successfully demonstrate the solution's capabilities and professional results you can achieve. An experienced user spent 10-15 minutes creating each of these samples.
Use the powerful tools of the Economy Infographics Solution for ConceptDraw DIAGRAM software to create your own infographics and diagrams of any complexity fast and easy, and then successfully use them in your work and personal activity.
All source documents are vector graphic documents. They are available for reviewing, modifying, or converting to a variety of formats (PDF file, MS PowerPoint, MS Visio, and many more graphic formats) from the ConceptDraw STORE. The Economy Infographics Solution is available for all ConceptDraw DIAGRAM users.