Renewable Energy Industry
Renewable energy industry is the energy industry focusing on the use of renewable energy sources. Solar, wind, hydroelectric, biomass, and geothermal power refer to renewable energy. Their use has a lot of benefits for both people and nature.
Renewable energy plays a key role in the decarbonization of the energy system and is absolutely complimentary energy source. It doesn't need to be mined or produced. Renewable energy sources provide energy and are nature-friendly. They allow avoiding temperature rising and cope with negative effects caused by extensive use of fossil fuels. Renewable energy sources allow reducing CO2 emissions, decreasing local air pollution, and do not consume oxygen.
The rate of use of renewable energy sources rises and it is incredibly useful today. Because the active burning of coal, oil, and other fossil fuels for the last decades has led to the extreme level of greenhouse gases. The fossil fuel emissions of greenhouse gases and carbon dioxide greatly affect environmental purity and contribute to global warming. The last one is a serious problem because it causes unexpected weather effects, rising sea levels, shifting wildlife populations, and many more negative impacts. In turn, there are no harmful emissions and planet-warming when renewable sources are used. Moreover, the use of most renewable energy sources is a rational and cost-effective solution.
Example 1. Renewable Energy Industry
Solar energy is the most popular source from a variety of renewable energy sources. It is based on the direct use of solar radiation to generate energy. Solar energy is environmentally friendly and does not produce harmful waste during extraction and use. The use of solar energy is actively developed around the world. China, Japan, and the U.S. occupy the leading positions.
Hydroelectric power and tidal energy are two technologies of using water sources. Hydropower is also one of the world's biggest sources of renewable energy. China, Brazil, Canada, the U.S., and Russia are the leading hydropower producers.
The use of wind energy is one of the most prospective areas today. Because the potential of wind is more than 100 times greater than ones of all Earth's rivers. One of the most common ways to convert the wind flows into energy is to use wind turbines. The wind turbines convert the energy of the flow into rotational motion, then it is transmitted to generators to produce an electric current. The U.S., China, and Germany are leading wind energy producers at the moment.
Biomass energy including biofuels like ethanol, biodiesel, biogas, wood is mainly used by developing countries. Biomass energy requires little processing and is available for areas with a low economic level. The most widespread generation of energy from biomass is in Kenya, India, and Brazil. Some developing countries use a combination of biomass and solar energy.
Geothermal energy derives from the Earth’s internal heat. Underground reservoirs of hot water and steam are used to generate electricity. Unlike solar and wind energy, geothermal energy is always available but the monitoring of the quantity of released hydrogen sulfide is required. Using geothermal sources is widespread in Indonesia, China, Japan, Kenya, New Zealand, Italy, France, Lithuania, Mexico, Nicaragua, Costa Rica, the Philippines, Tajikistan.

Example 2. Renewable Energy Library Design Elements
The Energy Industry Infographics solution from the Business Infographics area of ConceptDraw Solution Park is time-saving and helpful when designing infographics for the energy industry. It is useful for making an overview of the renewable energy industry and its advantages over the non-renewable energy industry.
The Energy Industry Infographics solution includes a lot of prime examples of read-made samples and examples and large collection of libraries including design elements - renewable energy, power engineering, solid fuel, liquid fuel, nuclear power, and many more.

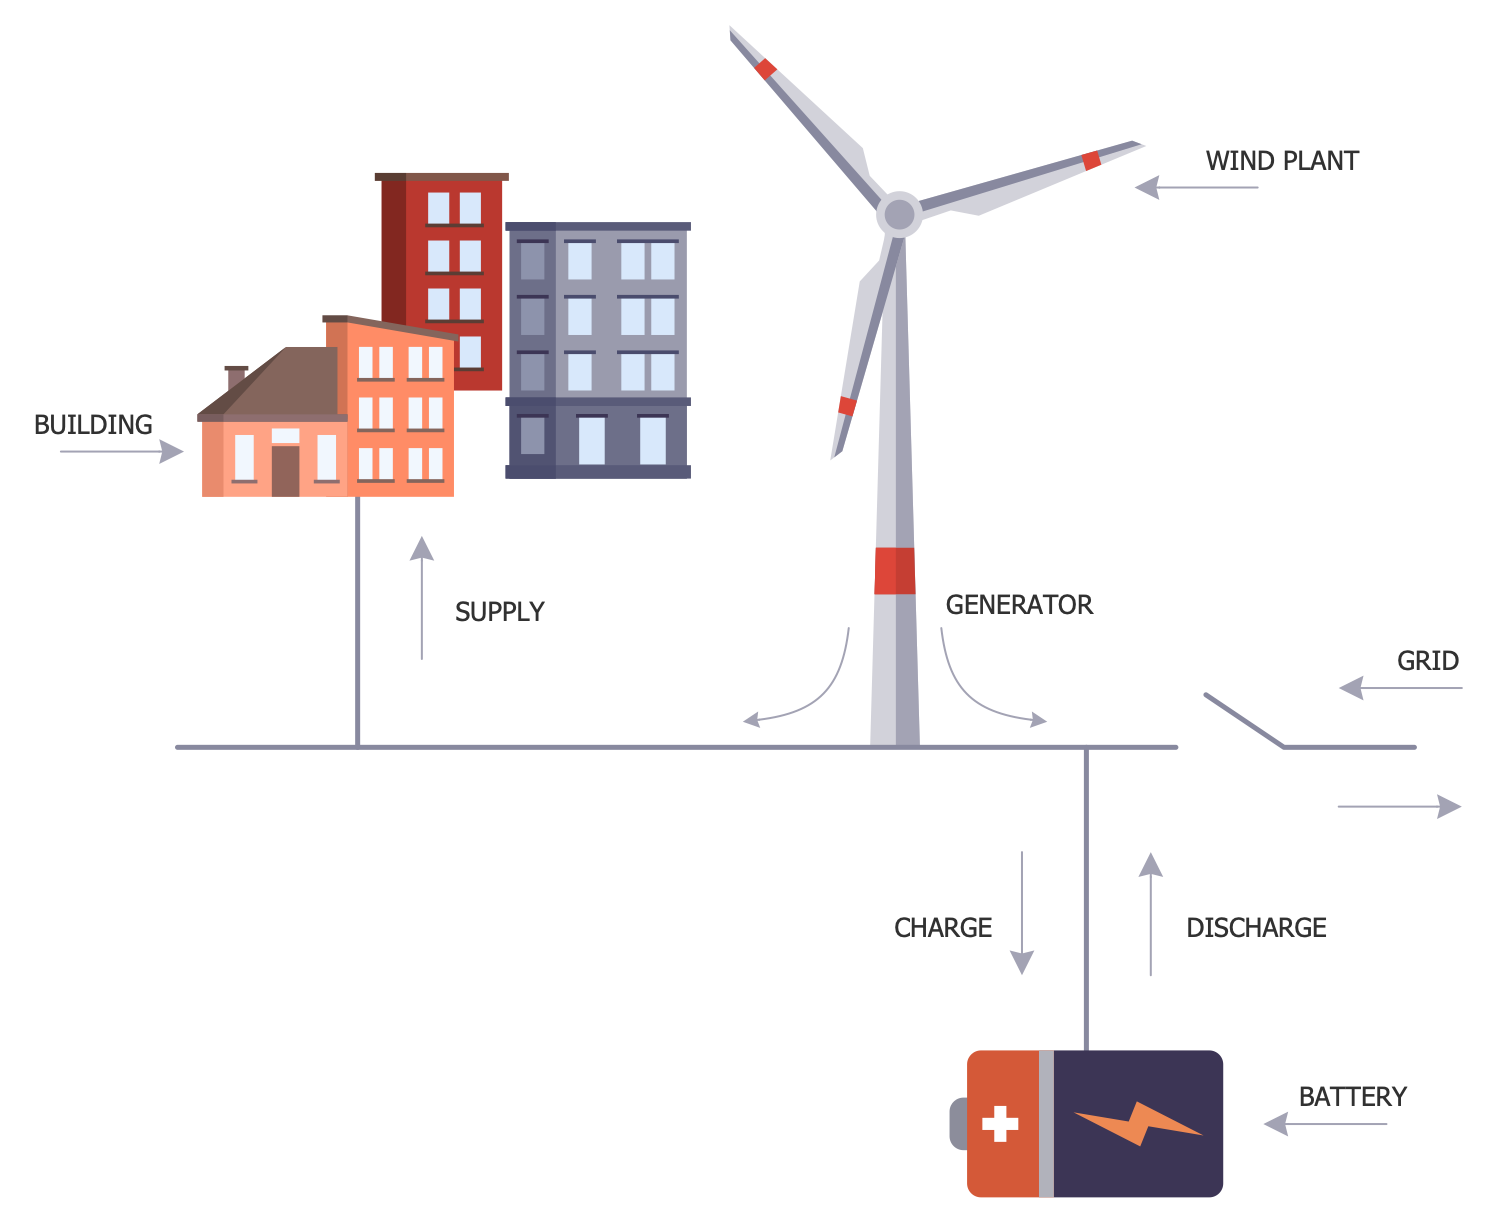
Example 3. Smart Grid
The samples you see on this page are infographics made for the energy industry. They were created in ConceptDraw DIAGRAM software using the Energy Industry Infographics Solution for ConceptDraw Solution Park. An experienced user spent 10-15 minutes creating each of these samples.
Use the Energy Industry Infographics Solution for ConceptDraw DIAGRAM software to develop your own professional-looking diagrams related to the energy industry quickly, simply, and effectively.
The possibility of exporting to a variety of popular graphical formats (PNG, JPEG, JPG, GIF, TIF, TIFF, BMP, DIB, EMF, SVG) and file formats like Microsoft PowerPoint (PPT), Adobe Acrobat (PDF), Microsoft Visio (VDX, VSDX), Adobe Flash (SWF), Encapsulated PostScript (EPS), HTML, opens wide opportunities for you.
TEN RELATED HOW TO's:
Accounting is a cornerstone of any business, it’s basement. If you want to have a visual representation of your finance management, use audit flowchart symbols to document the money flow. Although some would say that accounting is boring, it is very a responsible duty.
The audit flowchart symbols is supplied with ConceptDraw Audit Flowcharts solution as a vector objects library. Together with Conceptdraw Drawing capabilities it forms the helpful tool for audit process planning and setting the steps of audit by designing audit flow charts. Audit Flow charts are used to organize fiscal information tracking process as well as in accounting, finance and investment management.
Picture: Audit Flowchart Symbols
Related Solution:
Data structure diagram (DSD) is intended for description of conceptual models of data (concepts and connections between them) in the graphic format for more obviousness. Data structure diagram includes entities description, connections between them and obligatory conditions and requirements which connect them. Create Data structure diagram with ConceptDraw DIAGRAM.
Picture: Data structure diagram with ConceptDraw DIAGRAM
Diagramming is an astonishing way to visualize business processes. The list of the most common business process flowchart symbols is quite long starting from basic flowcharts, continuing with SIPOC diagrams. Business process modeling was never easier than now, with special ConceptDraw Business Process Mapping solution.
To carry out all professional standard requirements for business processes mapping, it is necessarily to follow the special graphical notations. ConceptDraw Business Process Mapping solution offers an exhaustive suite of tools to aid business process mapping. There are three vector libraries SIPOC Diagrams, Business Process Flowcharts, and Swim Lanes that contains totally more than 50 symbols of standard BPM notations. This is all that professionals need to effectively evaluate and manage quality in business processes.
Picture: Business Process Flowchart Symbols
Related Solution:
If you need to describe some process, diagramming is a perfect tool for almost any imaginable purpose. The set of the most commonly used flow charts symbols is quite wide and includes symbols for operations, processes, data inputs and outputs. You can see the full list of all the symbols used for flowcharting in Flowcharts solution from Diagrams area in ConceptDraw Solution Park.
A flow chart is often used for visual representation of a sequential process flow. The flowchart approach to any process is to divide it into some sequential actions. What makes a flow chart so popular and clear to make out is the set of standard flowchart symbols that has the same reading independently from processes described with their applying. The current drawing represents the vector library containing the pack of standard flowchart symbols. This library is supplied with ConceptDraw Flowcharts solution.
Picture: Flow Chart Symbols
Related Solution:
A flowchart is a simple but very functional tool when it comes to understanding a workflow or to removing unnecessary stages from a process. When drawing flowcharts, keep in mind that there are four common types of flowcharts, like document flowcharts and data flowcharts that show control over a data or document flow over a system. To show controls on a physical level, use system flowcharts. In addition, to show controls in a program, you can draw a program flowchart.
This flowchart diagram represents the piece of an article editing process, that involves the author and editor. It was created using the Basic Flowchart notation that consists from the basic flowchart symbols. The start and the end of the process are indicated with "Terminator" symbols. The "Process" symbols show the action steps consisting from making edits and searching for a compromise, when the author does not agree with the suggestions of the editor. The "Process" symbol is the general symbol in process flowcharts. The "Decision" symbol indicates a branching in the process flow. There are two branches indicated by a Decision shape in the current flowchart (Yes/No, Disagree/Agree). This basic flowchart can be used as a repeating unit in the workflow diagram describing the working process of some editorial office.
Picture: Types of Flowcharts
Related Solution:
Use ConceptDraw DIAGRAM diagramming and business graphics software to draw your own flowcharts of computer algorithms.
Picture: Process Flow app for macOS
Related Solution:
The ConceptDraw Flowchart component includes a set of samples and templates. This geathered as flowchart maker toolbox which focused on drawing flowcharts of any industry standards.
Picture: Flowchart Components
Related Solution:
Data flow diagrams are the graphical tool, used in the visualization of data flow of some data processing systems. It is the valuable process modeling tool. Also designing DFD is the important component of the initial part of any information system development project. The standard symbols are used to represent the interaction of a system components and how various kinds of components influence on data flow. The ConceptDraw Data Flow Diagrams solution is design to assist professional software engineers in making DFDs according to Gane and Sarson, and Yourdon and Coad notations.
Do you imagine yourself as a successful IT specialist? To your mind, they all use data flow diagram examples to learn and to get inspired. Aren’t you still with us?
Picture: Data Flow Diagram Examples
Related Solution:
ConceptDraw DIAGRAM is a world-class diagramming platform that lets you display, communicate, and present dynamically. It′s powerful enough to draw everything from basic flowcharts to complex engineering schematics.
Video tutorials on ConceptDraw products. Try it today!
Picture: Business Process Mapping — How to Map a Work Process
Related Solutions:
Event-Driven Process Chain Diagrams for improvement throughout an organisation.
ConceptDraw DIAGRAM - software that reduces the time needed to create a business process model.
Picture: Graphical Symbols to use in EPC diagrams
Related Solution: