Pulses
A pulse or a pulse signal is a surge of current, voltage, or electromagnetic field energy. It is a unidirectional, non-sinusoidal and not symmetrical signal. A pulse shape changes as a result of a sudden rapid change of a value from the baseline to a higher or lower one. In a certain period it returns to the baseline value. A series of continuous pulse signals, fixed-width electrical pulses or light pulses is called a pulse train or a pulse wave and is a periodic version of the rectangular function.
The electrical pulses can take a wide range of shapes: rectangular, triangular, bell, staircase, zigzag, or spire. The rectangular pulses are the most common. Pulses can transform a waveform or amplitude from one shape to another and distort the transmission of an electrical signal. The average level of a rectangular pulse wave is given by the duty cycle. Each of the pulses is placed on one of two discrete levels of amplitude.
The pulse signals are classified by count, duration or width, interval, and regularity. There are successive pulses generated repeatedly in succession and single pulses generated only once when an event occurs. The pulse duration is the period when pulses are turned on, it can differ from 0.1 second to several seconds. The time interval between turning on and off the repeated pulses is also significant. As for regularity, pulses can occur with a certain regularity or completely irregularly.
The pulses have a wide application in electronics, computer systems, physics, chemistry, medicine, and other fields. They are used in various types of motors to control driving by outputting signals in stepping motors and servo motors or measure various metrics using input signals, for example, to measure motor speed through the use of a rotary encoder. The pulses help to detect a fault in the devices or confirm their proper operation. Pulse waves are also used in synthesizers and their programming. The pulse width of the oscillator output or the duty cycle determines the shape of the wave. The modulation of the duty cycle in synthesizers helps to get a more dynamic timbre.
In common, the pulse generators are voltage sources. Simple pulse generators have a limited number of functions. They control the pulse frequency or repetition rate, pulse width or duration, the high and low voltage levels of the pulses, and delay concerning an internal or external trigger. The pulse width can range from 1 picosecond to a few minutes. Complex pulse generators provide more functions and allow controlling the rise time and fall time of the pulses.
Most pulse generators are single-channel and provide one frequency, delay, width, and output. But there are also multi-channel pulse generators, which produce multiple channels of various widths, delays, outputs, polarities, and even different repetition rates for each channel in some cases. The multi-channel generators are used to synchronize, delay, gate, and trigger the electronic devices, usually concerning one event.
The pulse generators may use digital or analog techniques, or their combination to form the output pulses. The most popular is the use of metal–oxide–semiconductor field-effect transistor (MOSFET) devices to generate the electronic pulse trains. It is reasonable due to the rapid on-off switching behavior of these electronic devices. Pulse generators are used to drive switches, modulators, intensifiers, lasers, optical components, and resistive loads. The output of a pulse generator is also used as the modulation signal for a signal generator.
Optical pulse generators are the lighting equivalent to electrical pulse generators. The light, for example, from a laser diode or a LED is their output. These generators control rate, delay, width, and amplitude.
Microwave pulse generators are devices generating ultra-short pulses with widths over 100 picoseconds. Typically, they apply the Step recovery diode (SRD) or Nonlinear transmission line (NLTL) methods. SRD-based pulse generators are inexpensive and easier to manufacture, but require several volts of input drive level and have a level of random jitter higher than NLTL-based pulse generators.
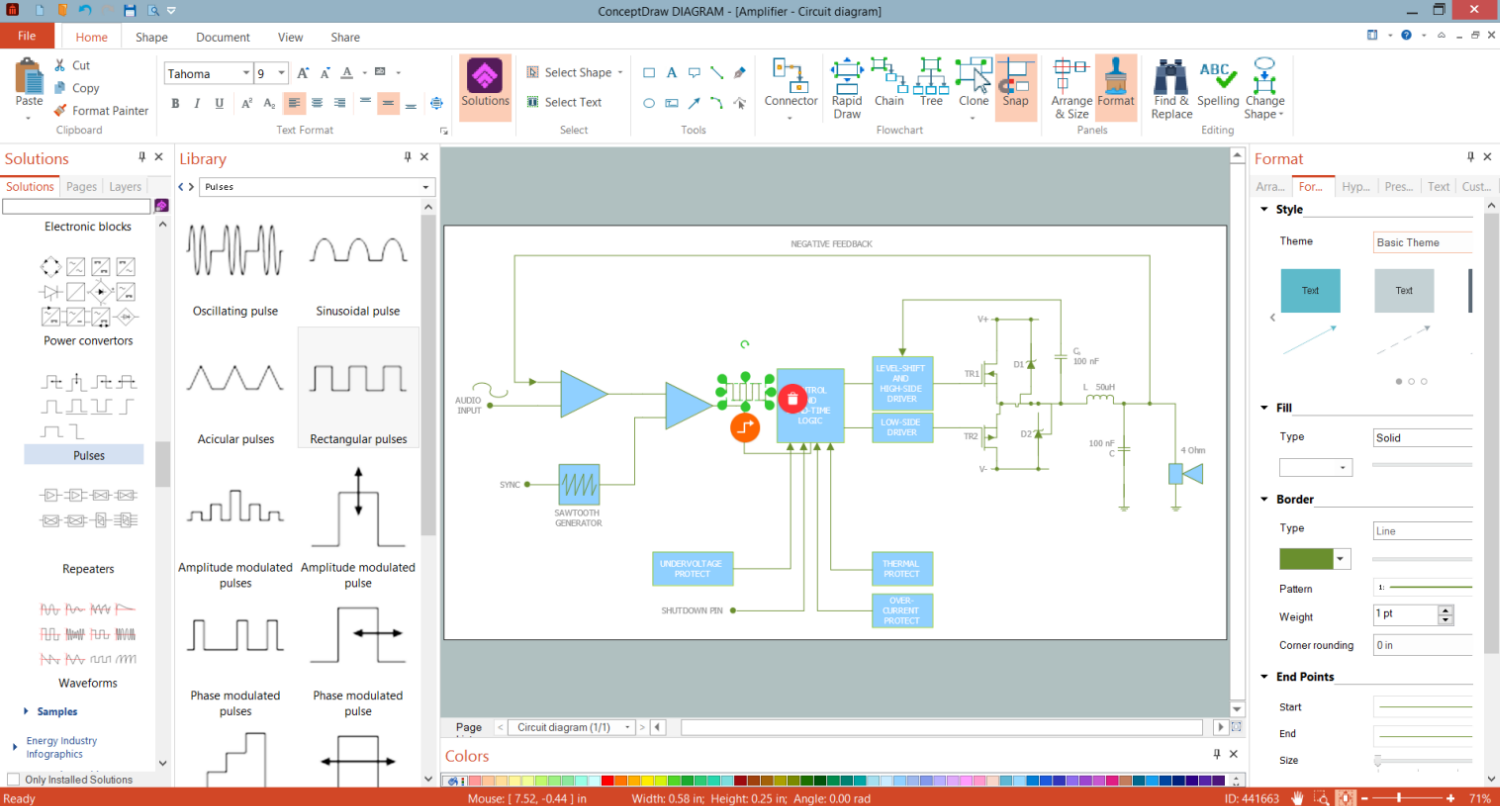
Example 1. Pulses Circuits Design in ConceptDraw DIAGRAM
Pulse modulation allows transmitting and generating electrical signals according to pulse changes. The most effective methods for motor control are Pulse width modulation (PWM) and Pulse amplitude modulation (PAM). The PWM method is used to control the current and voltage depending on the pulse width and interval. The PAM method allows controlling the current and voltage to pass depending on the pulse strength or amplitude.
Pulse code modulation (PCM) and pulse density modulation (PDM) are methods to convert analog signals like sound and video to digital signals. PDM method enables conversion with higher sound quality than the PCM.
Pulse position modulation (PPM) method converts signals to temporal pulse phase differences and is used in thyristor drives applied to adjust lighting, the temperature of heat sources, etc.
The pulse circuit is designed to produce electrical pulses, amplificate and transform them. Pulse circuits are widely used to develop various devices like electronic switches, electronic watches, alarms, electronic toys, electronic medical devices, household appliances’ timers, etc.

Example 2. Pulses Library Design Elements
Electronic Block Diagrams solution developed for ConceptDraw DIAGRAM software includes a collection of design elements libraries and samples of Electronic circuits and Electronic block diagrams of any complexity. Electronic Block Diagrams solution includes 8 libraries:
- Amplifiers
- Delay Elements
- Electric Filters
- Electronic Blocks
- Power Convertors
- Pulses
- Repeaters
- Waveforms
The symbols appropriate to all variety of pulses types you can find in the design elements — Pulses library. These include the symbols for the oscillating pulse, rectangular pulse, amplitude modulated pulse, phase modulated pulse, long pulse, positive rectangular pulse, negative rectangular pulse, sinusoidal pulse, amplitude modulated pulse, ladder pulse, acicular pulse, phase modulated pulse, pulse width modulated, step positive pulse, and step negative pulse.

Example 3. Electronic Block Diagrams Solution in ConceptDraw STORE
The Electronic circuits and Electronic block diagrams samples you see on this page were created in ConceptDraw DIAGRAM software using the drawing tools of the Electronic Block Diagrams Solution. These examples successfully demonstrate the solution's capabilities and the professional results you can achieve using it. An experienced user spent 5-10 minutes creating each of these samples.
Use the drawing tools of the Electronic Block Diagrams solution to design your own Electronic block diagrams and Electron circuits infographics quick, easy, and effective.
All source documents are vector graphic documents. They are available for reviewing, modifying, or converting to a variety of formats (PDF file, MS PowerPoint, MS Visio, and many other graphic formats) from the ConceptDraw STORE. The Electronic Block Diagrams Solution is available for ConceptDraw DIAGRAM users.
TEN RELATED HOW TO's:
When trying to figure out the nature of the problems occurring within a project, there are many ways to develop such understanding. One of the most common ways to document processes for further improvement is to draw a process flowchart, which depicts the activities of the process arranged in sequential order — this is business process management. ConceptDraw DIAGRAM is business process mapping software with impressive range of productivity features for business process management and classic project management. This business process management software is helpful for many purposes from different payment processes, or manufacturing processes to chemical processes. Business process mapping flowcharts helps clarify the actual workflow of different people engaged in the same process. This samples were made with ConceptDraw DIAGRAM — business process mapping software for flowcharting and used as classic visio alternative because its briefly named "visio for mac" and for windows, this sort of software named the business process management tools.
This flowchart diagram shows a process flow of project management. The diagram that is presented here depicts the project life cycle that is basic for the most of project management methods. Breaking a project into phases allows to track it in the proper manner. Through separation on phases, the total workflow of a project is divided into some foreseeable components, thus making it easier to follow the project status. A project life cycle commonly includes: initiation, definition, design, development and implementation phases. Distinguished method to show parallel and interdependent processes, as well as project life cycle relationships. A flowchart diagram is often used as visual guide to project. For instance, it used by marketing project management software for visualizing stages of marketing activities or as project management workflow tools. Created with ConceptDraw DIAGRAM — business process mapping software which is flowcharting visio alternative or shortly its visio for mac, this sort of software platform often named the business process management tools.
Picture: Process Flowchart: A Step-by-Step Comprehensive Guide
Related Solution:
Compare flowchart software by type, features, and workflow fit. Learn the difference between desktop and online tools and choose the right solution for documentation or collaboration.
Picture: Flowchart Software: Tools for Process and Workflow Diagramming
Related Solution:
A database is a data collection, structured into some conceptual model. Two most common approaches of developing data models are UML diagrams and ER-model diagrams. There are several notations of entity-relationship diagram symbols and their meaning is slightly different. Crow’s Foot notation is quite descriptive and easy to understand, meanwhile, the Chen notation is great for conceptual modeling.
An entity relationship diagrams look very simple to a flowcharts. The main difference is the symbols provided by specific ERD notations. There are several models applied in entity-relationship diagrams: conceptual, logical and physical. Creating an entity relationship diagram requires using a specific notation. There are five main components of common ERD notations: Entities, Actions, Attributes, Cardinality and Connections. The two of notations most widely used for creating ERD are Chen notation and Crow foot notation. By the way, the Crow foot notation originates from the Chen notation - it is an adapted version of the Chen notation.
Picture: ERD Symbols and Meanings
Related Solution:
ConceptDraw DIAGRAM - workflow software extended with the Workflow Diagram solution provides a complete set of samples, templates and features help you to draw diagrams faster. A workflow software you use for drawing workflow diagrams and business process flow diagrams should provide a wide set of examples allows you get closer with workflow diagrams, learn symbols meaning, find appropriate layout and design, and then start drawing your own workflow diagram masterfully. Workflow diagrams used for orchestrating organizational processes between company departments and humans, so critical process diagrams used to train many people to interact must be clear and professional to convey an idea from a view. Thats a reason we created a lot workflow symbols and workflow icons collected them into special Workflow Diagram solution in ConceptDraw Solution Park.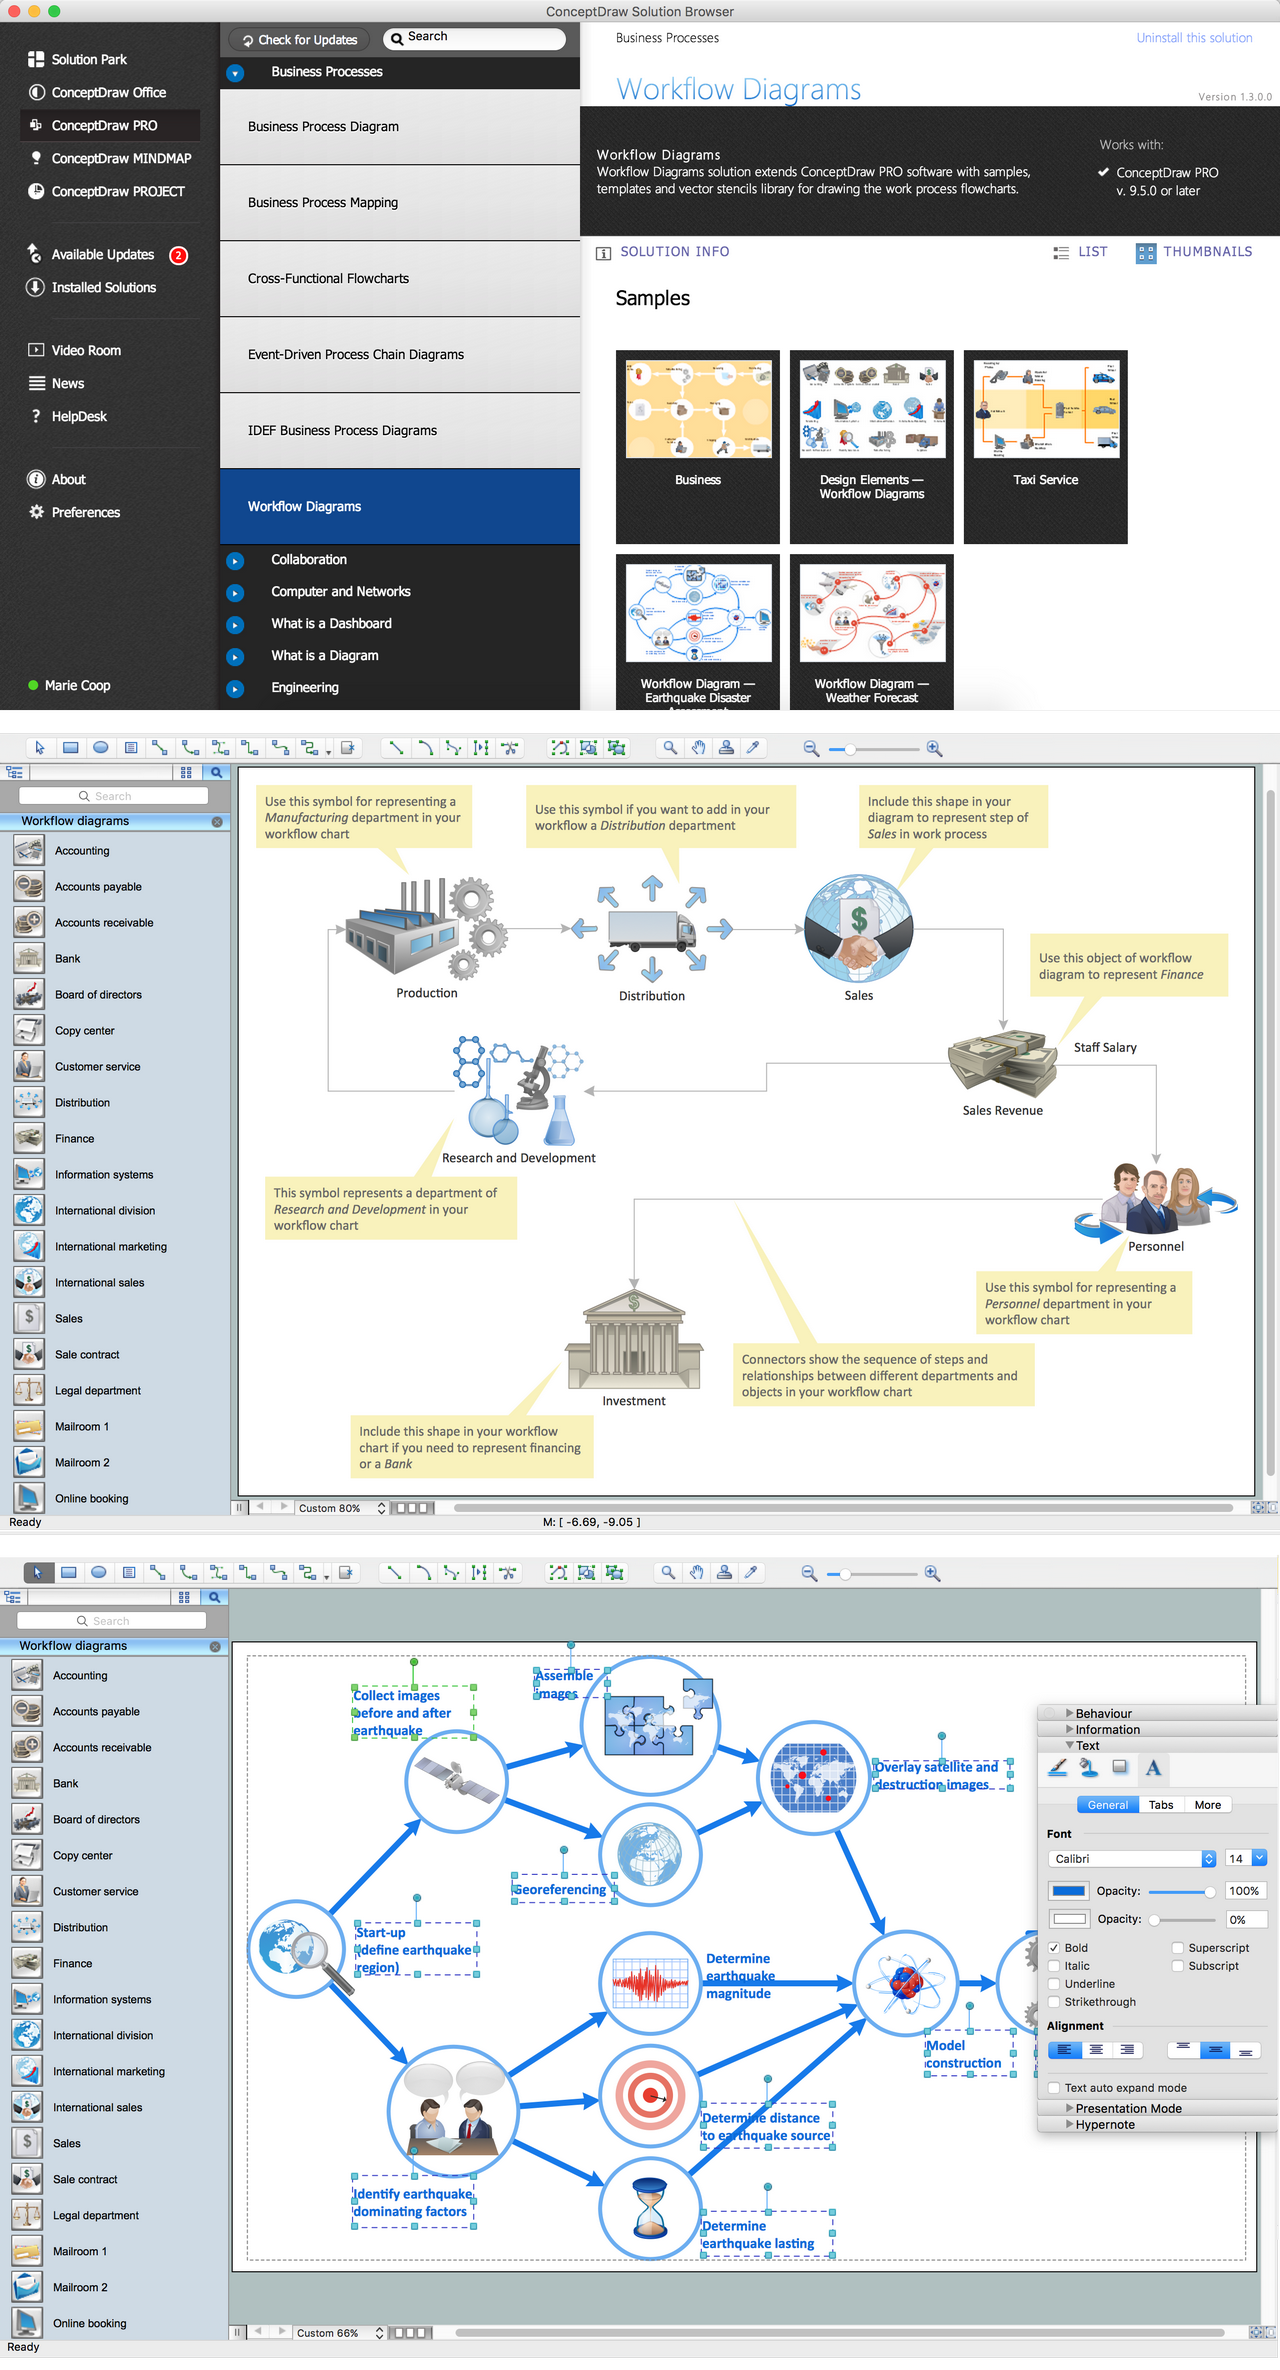
Picture: Workflow Diagram Examples
Related Solution:
If you are just a beginner in drawing flowcharts, it may seem that a sheet of paper and a pen are just enough. However, at the time you would want to share your results, diagramming applications would suite you better. it’s very easy to create diagrams that way and to discover new kinds of flowcharts.
The huge collection of sample ConceptDraw diagrams, charts, illustrations and other types of business drawings includes a wide range of business themes. A huge number of graphic images of ConceptDraw documents is divides on business application areas according to business-oriented solutions for which they were made.Here is a short visual list of samples of flowcharts, process diagrams, UML models, management charts, computer network diagrams, maps, infographics, illustrations, etc. In short, each ConceptDraw solution is accompanied with at least ten samples representing some particular examples of the application of the given chart.
Picture: Applications
When thinking about data visualization, one of the first tools that comes to mind is a flowchart design. You can find flowchart symbols, shapes, stencils and icons easily on the Internet, but it might take time to systematize this information. Nevertheless, once you start flowcharting, you’ll love its simplicity and efficiency.
This diagram consists from standard flowchart symbols, approved by ANSI (American National Standard Institute) for drawing flowcharts. A flowchart is a diagram that represents a step-by-step algorithm of any process, displaying the process stages as boxes that are connected with arrows. Flowchart design makes it clear and readable.
Flowchart designed using ConceptDraw DIAGRAM flowchart software allows to make attractive and clear process presentation, it makes interpretation of the business process flow fresh and versatile. Great flowchart design view is a big advantage over the diagram created manually on a paper.
Picture: Flowchart Design: Principles, Layout, Symbols and Best Practices
Related Solution:
It can be tough to get straight into business papers and processes.Otherwise, you can learn how to create flowcharts for an accounting information system and visualize these documents. Accounting diagrams are clear and easy to understand for all the participants of the process.
There are symbols used for creating accounting flowcharts using ConceptDraw DIAGRAM and its Accounting Flowcharts solution. Accounting flow charts are a special kind of flow charts. Actually a variety of flowcharts are often used to facilitate many aspects of a workflow of accounting department. Accounting flowcharts are utilized to support creating accounting documentation, to depict positions responsible for fulfillment of each phase of accounting workflow.
Picture:
How to Create Flowcharts for an
Accounting Information System
Related Solution:
A flowchart is a powerful tool for examining processes. It helps improving processes a lot, as it becomes much easier to communicate between involved people, to identify potential problems and to optimize workflow. There are flowcharts of different shapes, sizes and types of flowchart vary from quite basic process flowcharts to complex program flowcharts. Nevertheless, all these diagrams use the same set of special symbols like arrows to connect blocks, parallelogram to show data receiving or rectangles for showing process steps.
Basic flowcharts are used to represent a simple process algorithm. A basic flowchart notation consists of rectangles (business processes), arrows (the flow of information, documents, etc.). The same notation is used in items such as the "decision", which allow you to do the branching. To indicate the start of the entire business process and its termination can be used the "Terminator" element. The advantages of Basic Flowchart are simplicity and clarity. With it you can quickly describe the business process steps. Creating of Basic Flowchart does not require any special knowledge, as easily understand by employees with different levels of education and IQ.
Picture: Types of Flowchart: Comprehensive Overview
Related Solution:
There are many ways to track the system in a critical situation. To model a system behavior, uml notation is widely used. Usually, an UML diagram consists of elements such as actor and a case.
This diagram represents the structure of UML notations. Unified Modeling Language (UML) is used in software engineering to depict graphically the software modeling process. UM Language uses graphic notations for developing models of object-oriented systems. These notations displays requirements, sub-systems, logical and physical elements, etc. We created this diagram using ConceptDraw DIAGRAM reinforced with Rapid UML solution. It can be helpful for students on software engineering, when learning UML.
Picture: UML Notation
Related Solution:
Local area network connects computers and other network appliances within an area, such as office building or a campus. It can be difficult to provide such network without a predesigned plan. For these purposes you can use network diagram software, which helps you to create LAN network diagrams and office network diagrams quickly and effortless. This will speed up your work and you can save the diagram for the future network improvements.
The following diagram illustrates a network topology of the small office. LAN configuration has a star topology. The local network joins 8 computers among which are several desktop PCs, laptop, two iMacs and iBook. The end-point devices are divided into three groups. Each group is connected to its hub. There is a network printer and a modem, which are interconnected with other devices through a network server. Each computer on the LAN can access the server through a corresponding hub.
Picture: Network Diagram Software. LAN Network Diagrams. Physical Office Network Diagrams
Related Solution:

