Pareto Chart
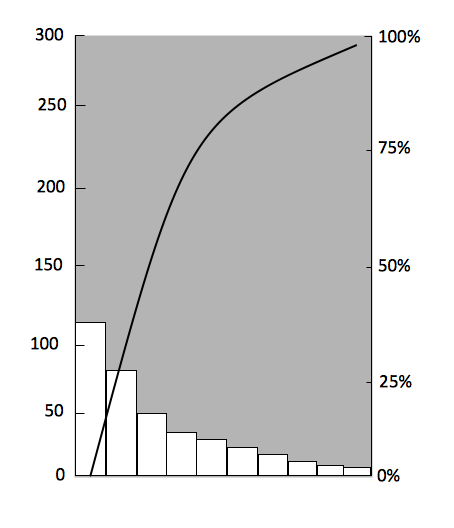
This sample shows the Pareto Chart. It was created in ConceptDraw DIAGRAM diagramming and vector drawing software using the Basic Diagramming Solution from the Universal Diagramming area of ConceptDraw Solution Park.
A Pareto chart is a type of the chart that graphically summarizes and shows the relative importance of the differences among the groups of data. On the Pareto chart there are displayed at the same time a bar graph and a line graph. The descending values are represented by the bars and the cumulative total values - by the line. A Pareto chart was named after the Italian economist Vilfredo Pareto. Pareto charts are used in the areas of the quality improvement and the time management.

Sample 1. Pareto chart.
Using the ready-to-use predesigned objects from the Basic Diagramming Solution for ConceptDraw DIAGRAM you can create your own professional looking Pareto Charts quick and easy.
The Pareto Charts produced with ConceptDraw DIAGRAM are vector graphic documents and are available for reviewing, modifying, and converting to a variety of formats (image, HTML, PDF file, MS PowerPoint Presentation, Adobe Flash or MS Visio).