Infographics Maker Software
Infographics are a modern and popular form of visual communication. They capture attention and enhance comprehension of different kinds of information and data with the help of visual graphics, images, clipart, thematical symbols, charts, etc. Infographics are a handy way to pass on important information to the audience. Therefore they are extremely beneficial to business.
Infographics are used to display complex information in a simple, but informative form, sometimes even entertaining way. Visual representation of facts, events, or numbers has benefits in any area. It makes infographics visually appealing and memorized to the audience. It is a proven fact, that graphical visual content gets more popular and gains greatly more views on the web and in social media than textual content. This leads to the success of advertising and business campaigns, promotion of products or services on a market, and attracting a wide audience.
Infographics make information appealing to people who are looking for it and those who face it accidentally. As a result, your target audience grows. So, infographics are a great way to find new leads for your business, connect with new people, and a chance to set long-lasting relationships.
Infographics come in various forms and formats in accordance with the field and target audience. They differ in purpose, types of content, and style. At the same time, they may combine aptly different styles and elements from multiple types, like different areas can intersect each other. How-to infographics are similar to guidance, manuals, and instructions. Process infographics display the process steps, depict a decision-making process, product development process, etc. Timeline infographics display events or actions in chronological order and help to show a series of chronological events. Comparison infographics explore the pros and cons, similarities and differences of products, services, events, actions, or any other items or activities. Numerical infographics are focused on numbers and often include graphics or charts, helping to display statistical data, statistical facts, results of surveys, company performance, etc. In any way, visual infographics keep your audience better engaged than written content.
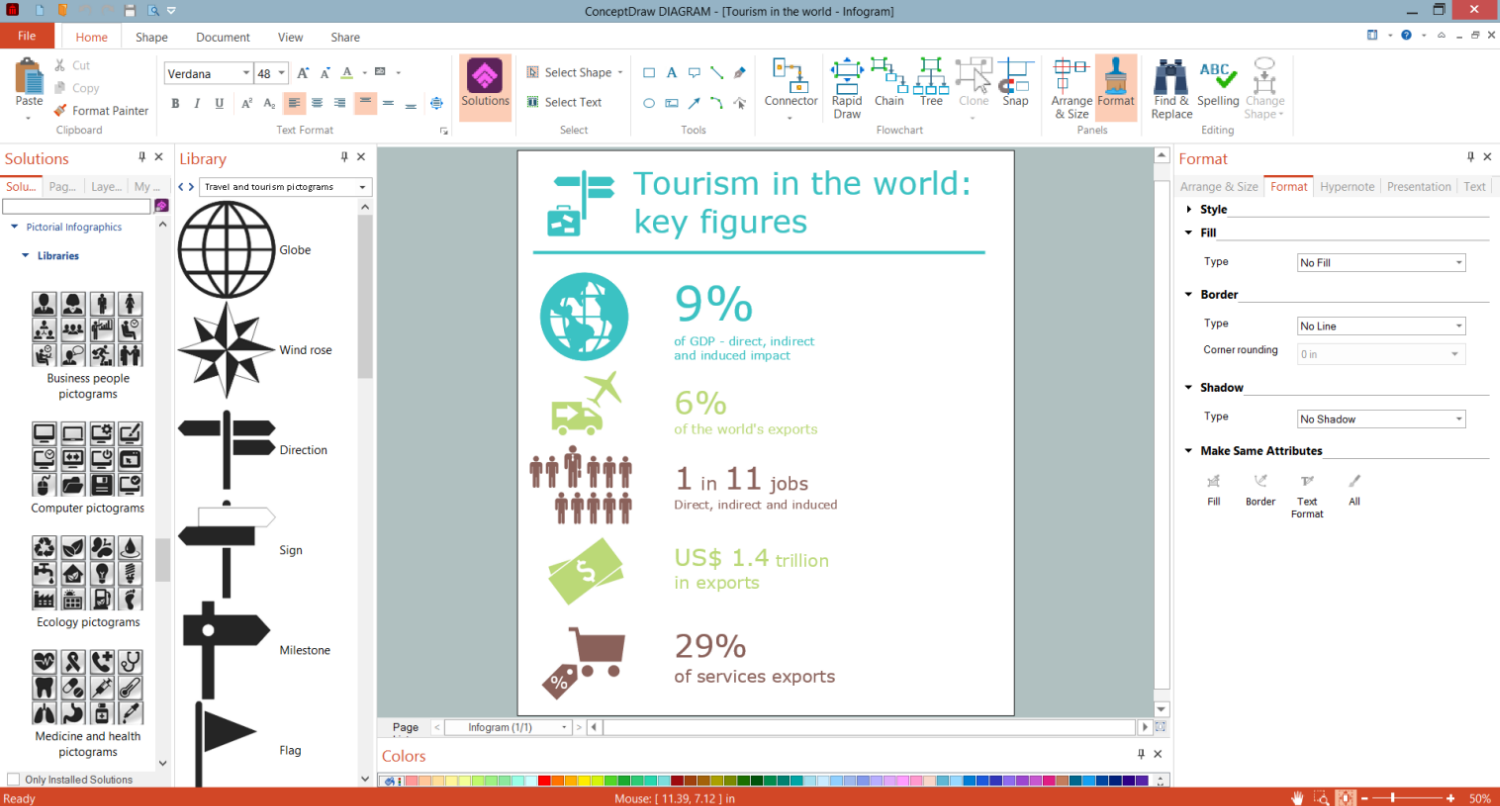
Being used in business, infographics can help to make your brand recognizable, get new people familiar with it, and increase reach to your target audience by displaying your brand's features and your unique style. They are used to connect with people interested in your business, find new leads or prospective partners, for example, explain about tourism in the world, or any other specific information. It is an excellent element of the content marketing strategy. At the same time, infographics can include both general information or specific one, aimed at some aspects of your business and presented only for a close circle of people in the form of reports or documentation materials.

Example 1. Infographics Maker Software ConceptDraw DIAGRAM
Infographics help to visualize data and information, and suit ideally for use in presentations, reports, newspapers, magazines, billboards, news, forecasts, promotion and advertising campaigns, education, etc. Infographics are popular for use on the web and in real life, in public places, on streets, and in public buildings.
Create eye-catching visuals and attractive content in the form of visually appealing and engaging infographics fast and easily in ConceptDraw DIAGRAM infographics maker software. Being enhanced with Pictorial Infographics, Financial Infographics solution, Education Infographics solution, Management Infographics solution, and many other infographics solutions, it offers key advantages for drawing. It provides a large collection of pre-made vector design elements and clipart, colorful, attractive, resizable, and ready-to-use by drag-and-dropping from the solution libraries.
Strive to present information in a way that is attractive and the easiest to understand by your audience without information overload to lead them to engage with your content more, to follow your news, actions, new products or services. The ready infographics are easy to save to different formats and share directly from the application or send by email.
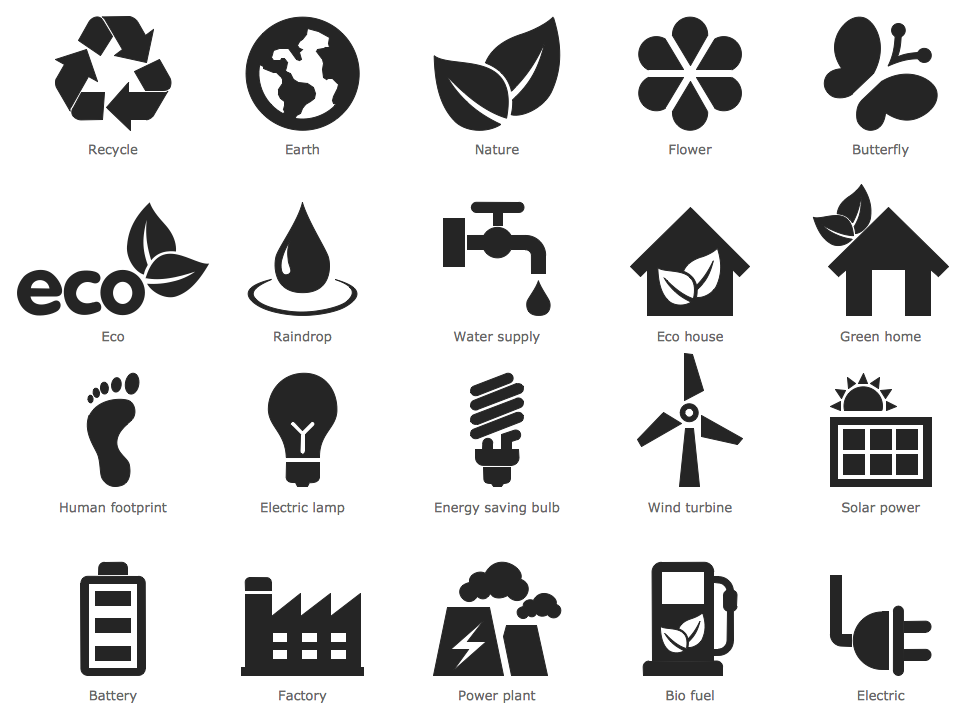
Example 2. Ecology Pictograms Solution Design Elements
Colors make your infographics eye-catching, use them to highlight information. Be careful to make it in a unified style, so that the background was in accordance with all other visual graphical content. If you have your own brand, it makes sense to use the official brand colors. Pay attention to psychological aspects and account that some colors evoke certain emotions or are associated with specific areas, like for example green color is commonly related to nature, biotechnologies, saving the environment, and a healthy lifestyle. Infographics are supposed to use a minimum of text, but important messages or slogans are acceptable. At the same time, pay attention to the readability of used fonts.
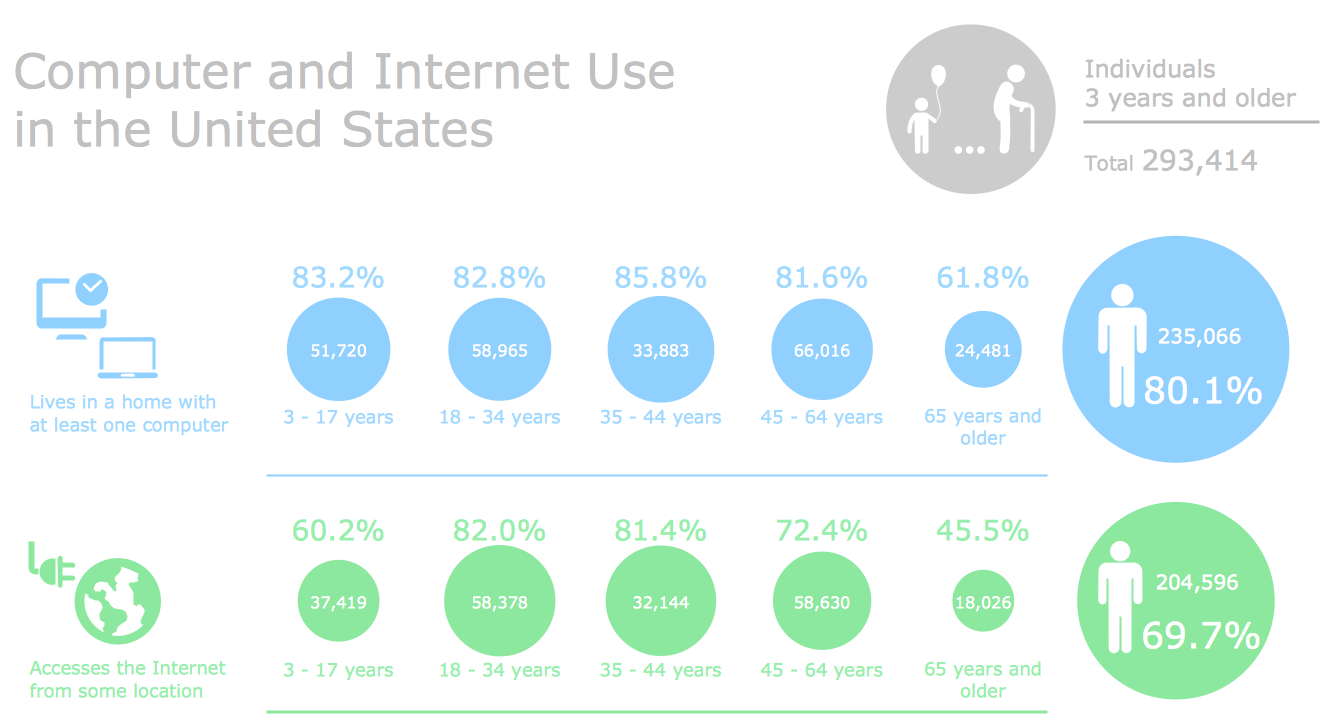
Example 3. Infographics — Computer and Internet Use in the United States
The Infographics samples you see on this page were created in ConceptDraw DIAGRAM software using the drawing tools of the Pictorial Infographics Solution. These examples successfully demonstrate solution's capabilities and the professional results you can achieve using it. An experienced user spent 10 minutes creating each of these samples.
Use management tools of the Pictorial Infographics solution for ConceptDraw DIAGRAM software to design your own infographics of any complexity fast and easy, and then successfully use them in your work and personal activity.
All source documents are vector graphic documents. They are available for reviewing, modifying, or converting to a variety of formats (PDF file, MS PowerPoint, MS Visio, and many other graphic formats) from the ConceptDraw STORE. The Pictorial Infographics Solution is available for ConceptDraw DIAGRAM users.

