Infographic Project Management
An infographic represents information, data, and facts in an appealing graphic format to make them easily understandable at a glance. Visual aids such as images, clipart, charts, graphs, diagrams, graphic timelines, etc. are used in balance with text. Our society is visually focused because of the human mind's property to process information in pictures much faster than in words. Therefore infographics attract and inspire audiences more than text-based content, help the brain to work through complex information faster.
It is proved that visuals speed up the rate at which information is processed and respectively speed up decision-making. In addition, infographics are useful for conveying large amounts of information in a simple view, they easier indicating relationships and monitoring changes, engaging target audience. They also help to prevent information overload when processing the information.
Infographics are used extensively on the web for various purposes, on websites, in social media ads, including email marketing, blog posts, etc. Infographics help people to communicate with each other efficiently, show new ideas, developments, research, and explain concepts. Visual content with useful and meaningful information helps your business projects to be best promoted and builds brand credibility. Infographics help identify and analyze key characteristics in a specific area. They are beneficial in advertising, improve decision-making, and increase your content’s exposure.
The information included in infographics helps your target audience to learn new things, analyze information, and focus on important data you want to convey. Infographics are beneficial for presenting complex ideas in an easily digestible manner breaking them down. They are versatile types of content for any business, which help your business communicate its end goal quickly and efficiently. Attractive infographics allow you to gain value for your activity easily.
Being used in project management, they help to manage both simple and complex projects, make project management decisions, explain complex concepts, present a new product or service, show advantages of the project and business achievements, allocate budget, and help in planning its improvement and development. Project management infographics help to keep your business organized and projects implemented on time. They increase awareness and help to choose between different project management methodologies and approaches for better results. Infographics can summarize key points, be a roundup of implemented actions within a selected strategy, assign tasks and prioritize, plan timelines and set deadlines, cope with problems and avoid conflicts.
Infographics are an effective tool for using in both printed materials and on the web, they are able to drive more traffic to your site and attract followers to your brand in social media. It is one of the most effective marketing tactics to expand digital footprint, drive interest for many brands, and bring more clients.
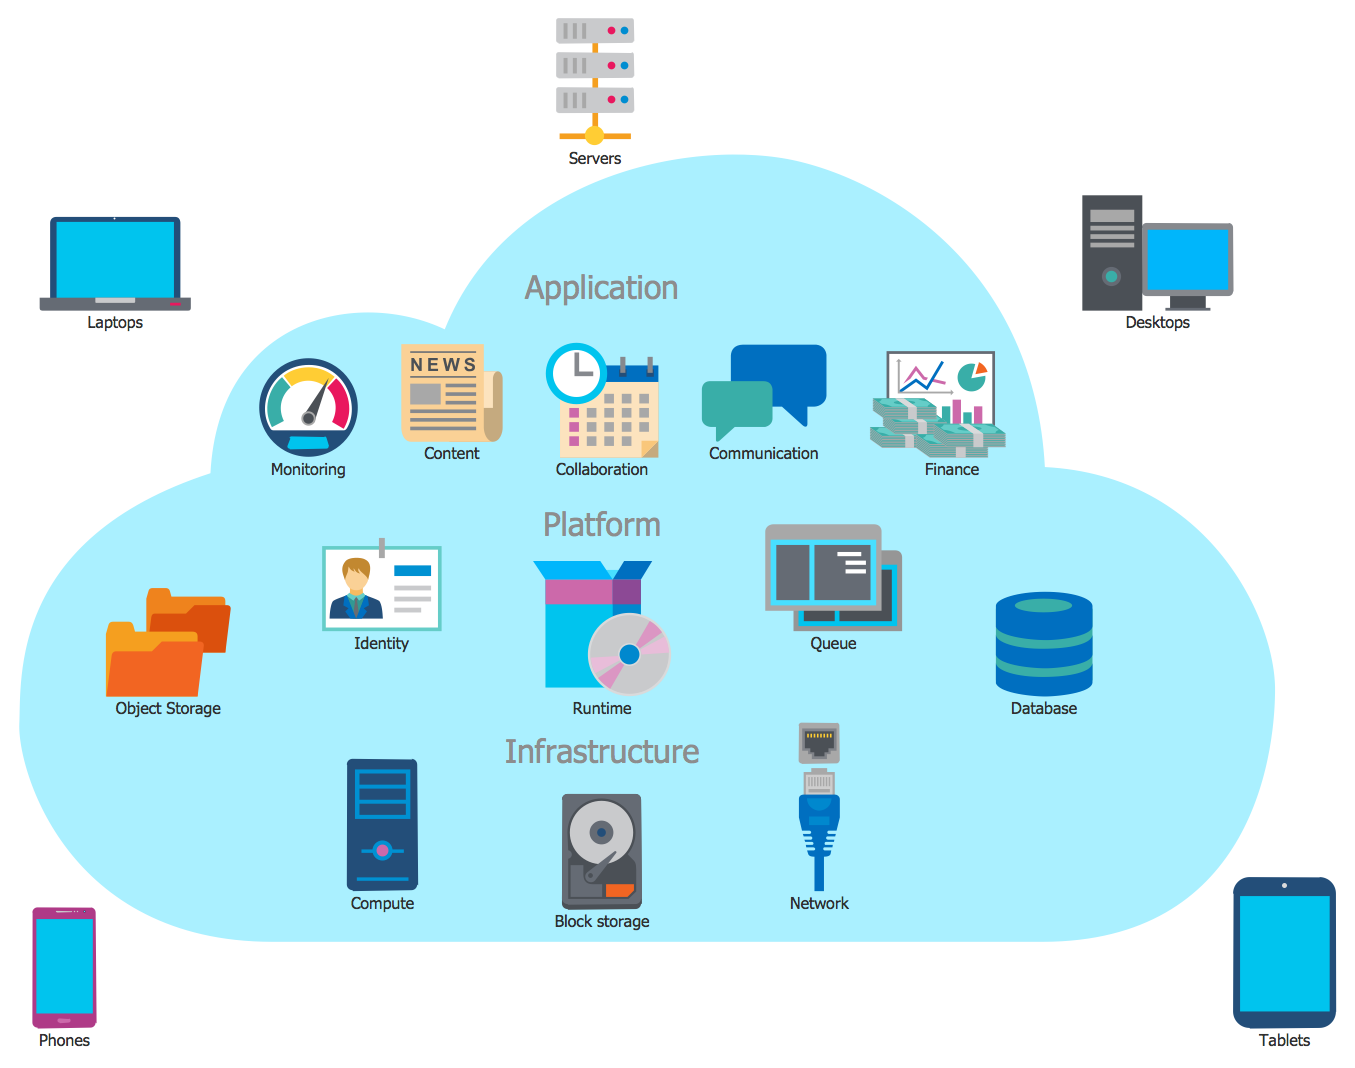
Example 1. Infographic Project Management Design in ConceptDraw DIAGRAM Software
Convey complex information in a simple format, improve your productivity and creativity, and increase your potential reach by publishing infographics created in infographic project management software ConceptDraw DIAGRAM with the help of the Management Infographics solution or other solutions from the Business Infographics package or Project Management package.
Create efficient and attractive visual content, power-packed with useful information, data, resources, and relevant images to interest the audience and boost its engagement about important topics. The solutions include a wide range of infographic icons and samples of well-designed infographics, customizable and flexible to your needs when used as templates.
Don't miss out on the opportunities of digital marketing, use infographics as a part of your content strategy. ConceptDraw DIAGRAM provides abilities for content shareability. Infographics are easy to reference, share with colleagues, clients, friends, and other stakeholders. Compile reports, present your business or company data in an effective compelling and engaging way, monitor online reviews, easier reading text-heavy content, and improve your business’s local rankings easily.

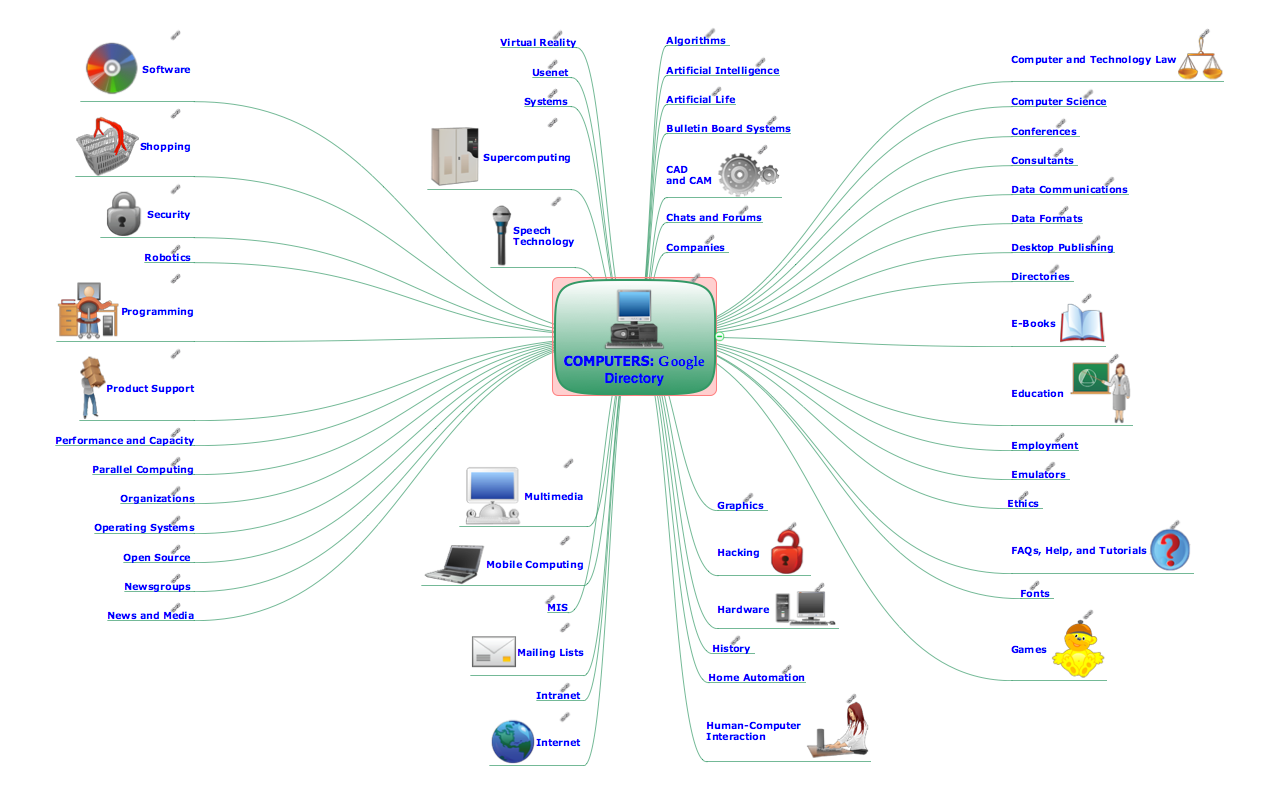
Example 2. Management Infographics Libraries Design Elements
Interesting, informative, easy-to-consume, credible, and uniquely designed infographics complement your branding strategy and can help people learn more about you, your business, projects, products, or services. Plan, execute, and track projects of any size, make your content marketing strategy successful with visually appealing infographics. To improve your infographic’s readability, use attractive colors that adhere to your branding and easy-to-read fonts.
Collaborate seamlessly across teams and departments to gain visibility into the progress of your work, set project timelines, and manage their work successfully. Choose the content relevant to your target audience and follow the brand’s identity in all your infographic materials to make your brand recognizable through them. The brand awareness raises your credibility among your audience and expands your business opportunities.
Management Infographics solution offers powerful management tools and 14 libraries with the design elements — management pictograms, management indicators, charts, callouts, maps, and many other elements.

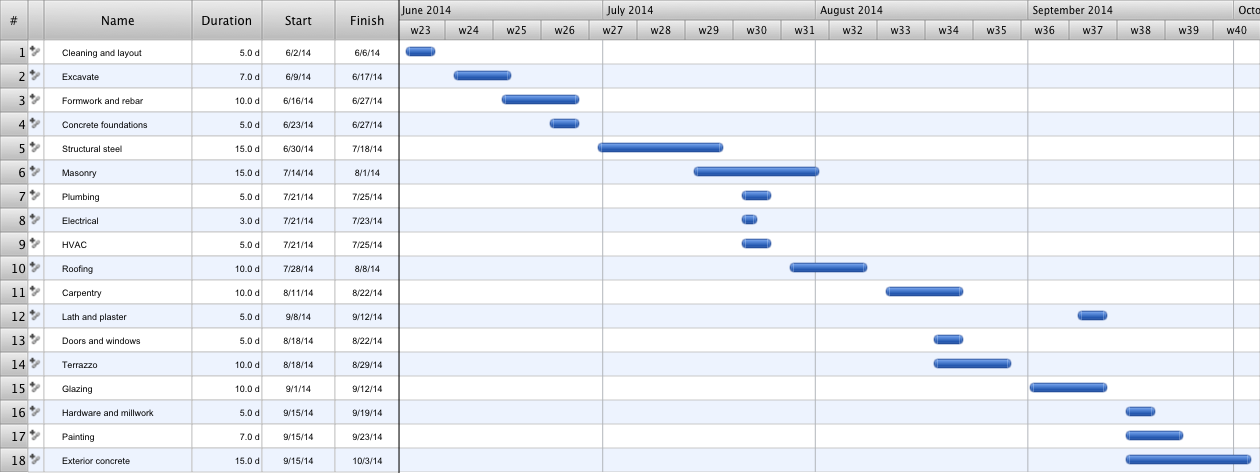
Example 3. Labour Market 2014 Management Infogram
The Management Infographics samples you see on this page were created in ConceptDraw DIAGRAM software using the management tools of the Management Infographics Solution. These examples successfully demonstrate solution's capabilities and the professional results you can achieve using it. An experienced user spent 5 minutes creating each of these samples.
Use management tools of the Management Infographics solution for ConceptDraw DIAGRAM software to design your own infographics quick and easy, and then successfully use them in your work and personal activity.
All source documents are vector graphic documents. They are available for reviewing, modifying, or converting to a variety of formats (PDF file, MS PowerPoint, MS Visio, and many other graphic formats) from the ConceptDraw STORE. The Management Infographics Solution is available for ConceptDraw DIAGRAM users.