Infographic
Although economics is a quite complex and multifaceted field, infographics can make it easy to understand. Because visuality is a key to simplicity and understanding. Visual representations, images, illustrations, and infographics are effective ways to convey key concepts and ideas related to economics, business, trade, currency, markets, spending, and profit.
Infographics are the best to show information and data in many fields of science, business, and life. They help quickly convey information to a general audience in an attractive way. Infographics help people easily remember facts, data, figures, and more. Because images make information easier to understand and remember than if it is presented in a pure textual or even table form.
Infographics are really effective. Typically, they combine the written words, slogans, short texts and visual elements, pictures, illustrations, diagrams, dashboards. Infographics can have absolutely different forms, include simple information, a small amount of data. They are dedicated to one idea or can have a complicated form and include large amounts of different information. But as a rule, simple infographics are the most effective.
Diversity of economic issues is affected in infographics, you can display everything you need. You can present the economic processes, connections in global markets, statistics data and economic indicators, economic concepts, and more. Infographics and illustrations help better understand key concepts about economics or vice versa explain them to your audience. You can show the stakes of spending and profit, flows of economic processes, variety of currencies, compare the key economic indicators, generate the comparative characteristics, and many more.
The effective infographics are highly readable and easy to understand. But however, they allow to pack big ideas into small spaces, make economic researches and present their results. Try to design your infographic to fit on the page to see it overall. Also, you can include the dashboards, flowcharts, timelines, maps in your infographics. Highlight important details with contrasting colors to make them eyes catching.
Moreover, visual graphics and infographics facilitate the analysis and processing of economic data, monitoring the dynamics of indicators and factors influencing them. Use infographics to monitor changes, detect ups and downs, make predictions, and take correct economic and business decisions.
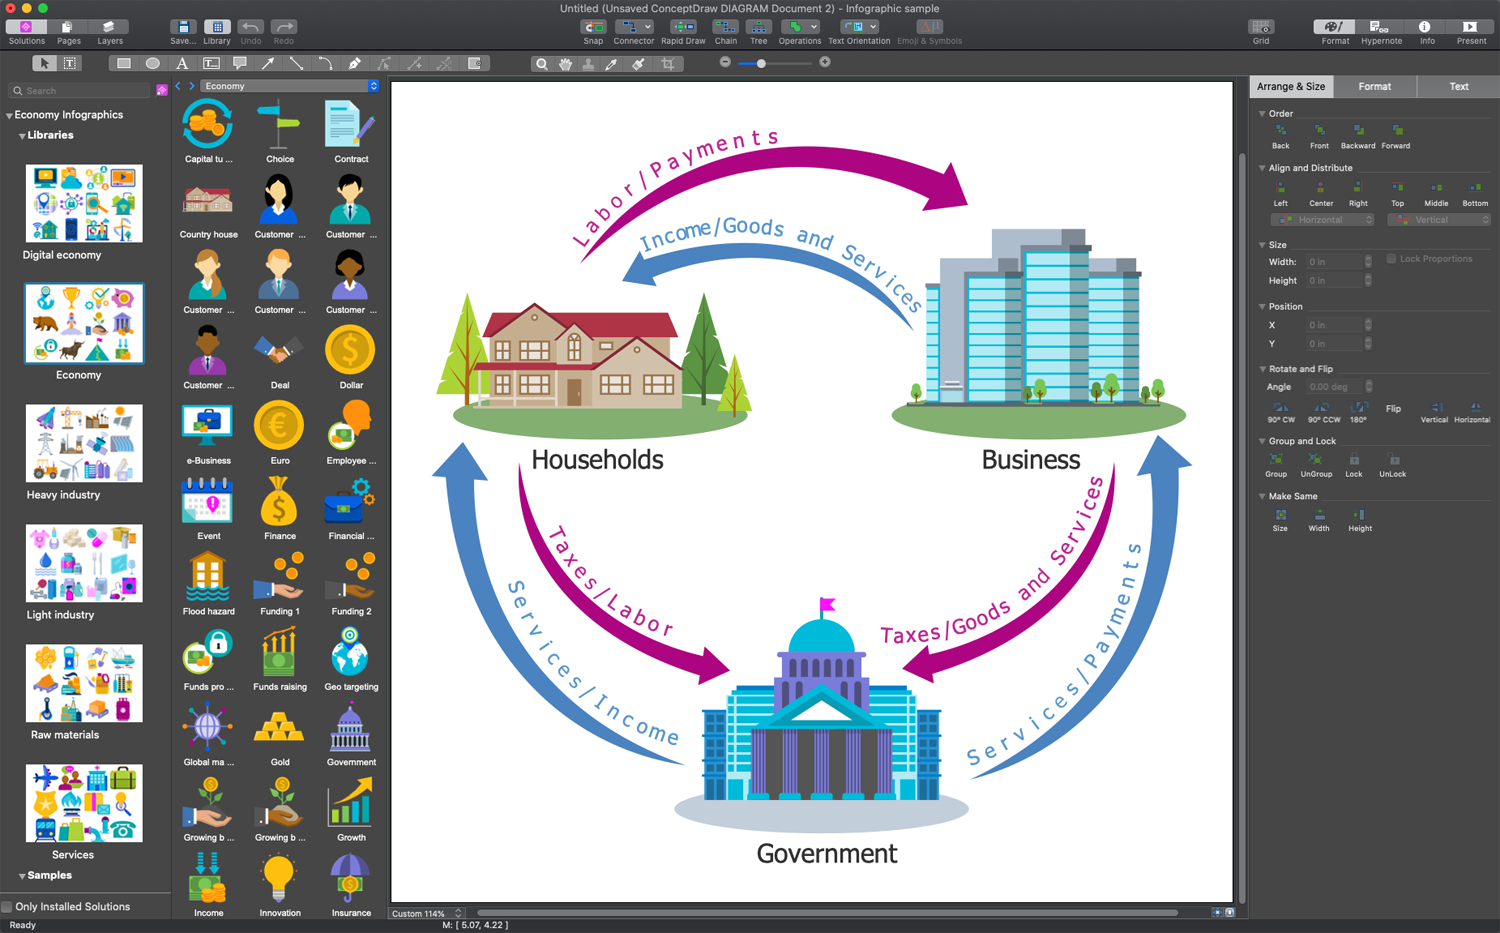
Example 1. Economy Infographic Design in ConceptDraw DIAGRAM
Striving to design effective economic infographic, open the ConceptDraw DIAGRAM and start with Economy Infographics solution without delay. Experience the simplicity and efficiency of the use of ConceptDraw DIAGRAM software for all stakeholders designing economic infographics.
The extensive functionality, innovative design, user-friendly drag-and-drop technology, and high-quality clipart support users in drawing their infographics, diagrams, and illustrations within minutes. Simply drag and drop the vector design elements — raw materials, economy and digital economy, heavy and light industries, services, and more from the libraries into your document. Arrange your objects in a desired way and type text to get stunning infographics.

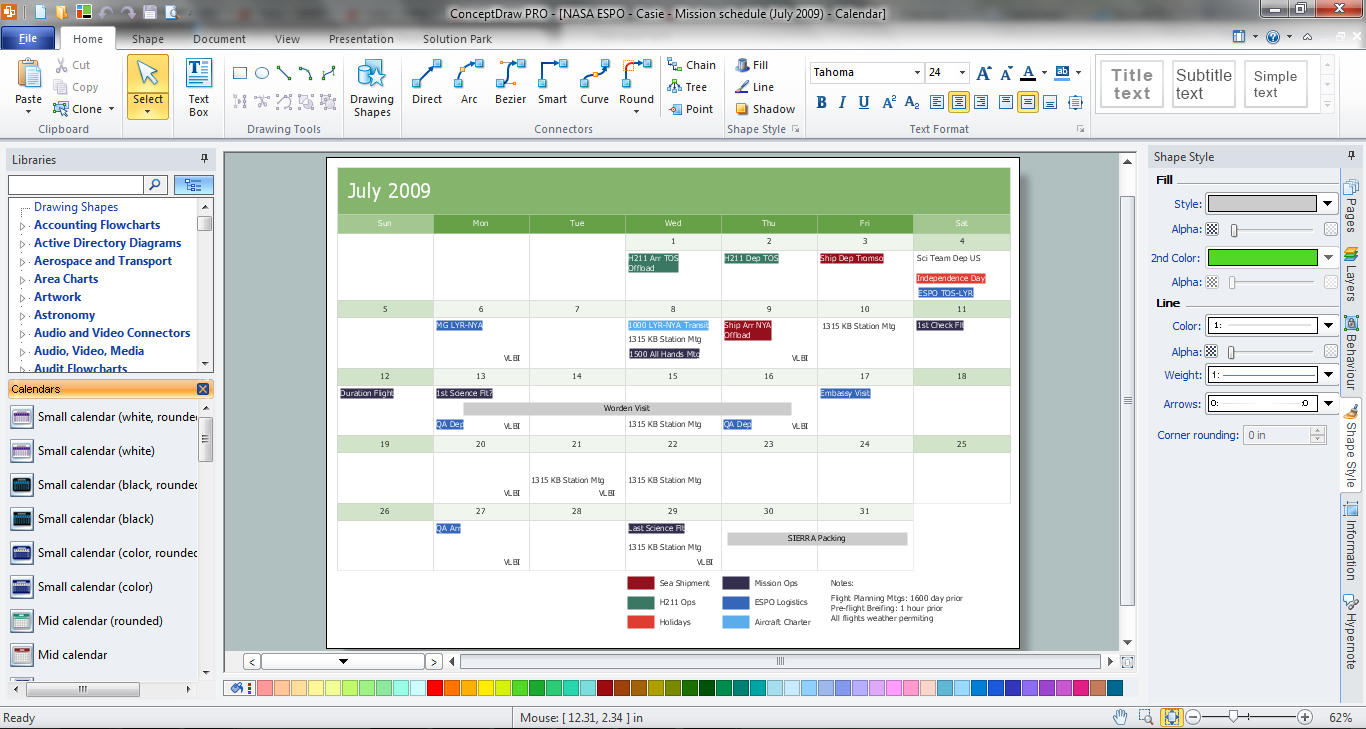
Example 2. Main Processes of a Company
ConceptDraw's vector objects allow designing the high-resolution infographics to illustrate effectively websites, publications, reports, documents, social media posts, posters, presentation slides, and more with economics infographics. Get started with one of the pre-made samples or templates or with a blank sheet.

Example 3. Business Process Framework eTOM
The infographics you see on this page were created in ConceptDraw DIAGRAM software using the Economy Infographics Solution and its pre-made pictograms and clipart. They successfully demonstrate the solution's capabilities and professional results you can achieve. An experienced user spent 10-15 minutes creating each of these samples.
Use the powerful tools of the Economy Infographics Solution for ConceptDraw DIAGRAM software to create your own infographics and diagrams of any complexity fast and easy, and then successfully use them in your work and personal activity.
All source documents are vector graphic documents. They are available for reviewing, modifying, or converting to a variety of formats (PDF file, MS PowerPoint, MS Visio, and many more graphic formats) from the ConceptDraw STORE. The Economy Infographics Solution is available for all ConceptDraw DIAGRAM users.