Family Genogram Example
A Genogram is a family map or family tree that illustrates the family history and relationships between family members over multiple generations. It provides information about key family members, who is related to whom, significant individual qualities of family members, dynamics, and major events using special symbols and linkages. A genogram is similar to a family tree with multiple generations, most often it includes from three to five generations. However, it is usually more complex and includes more information than the traditional family tree.
Genograms help to explore the complexity and dynamics of relationships, health information (mental, physical, and genetic), patterns of behavior, psychological factors that affect relationships, and many more nuances that span different generations. They are a visual picture of family relationships, show the diversity in the family, help to identify trends, psychological factors that affect the relationships within the family, and how each family member sits within the complex dynamics of own family.
Genograms are an incredibly powerful tool. They are helpful for a range of professionals including doctors of different specializations, psychologists, historians, researchers, etc. They often include medical information about diseases of ancestors, genetic and hereditary conditions, explain psychological specialties, and are useful in numerous directions of medicine: family therapy, psychotherapy, psychology, counseling, and genetics. They help to track how the condition passes from one generation to the next, evaluate possible risks of occurring diseases or disorders for descendants, patterns of illnesses, and understand the health history better. They are useful to realize genetic research, make medical conclusions, and prescribe efficient treatment plan. The genograms also find multiple applications beyond medicine and family use, help social services, education, businesses, etc.
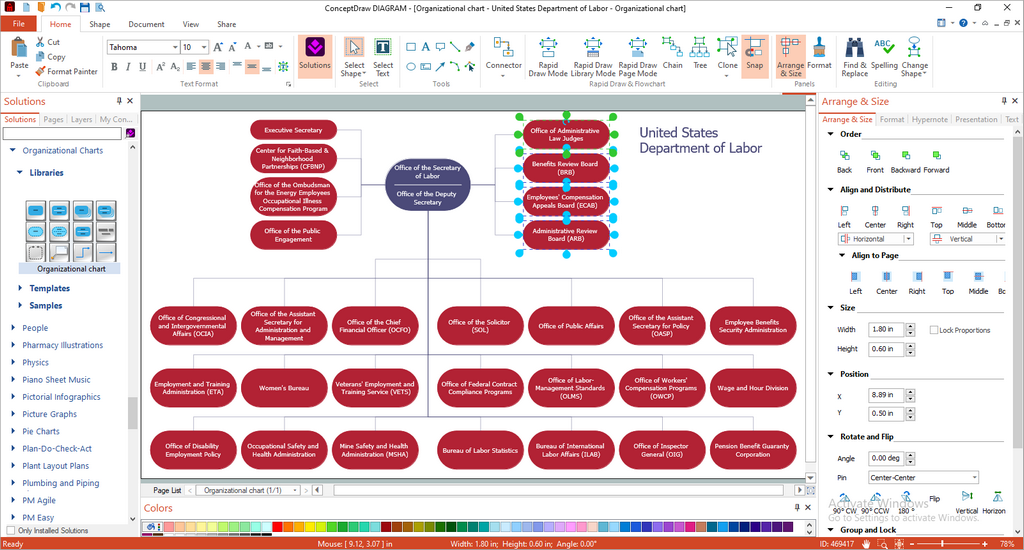
Example 1. Family Genogram Example in ConceptDraw DIAGRAM Software
Each line in the genogram represents one generation. Each person is represented by a symbol; usually, males are represented by squares and females by circles. The symbols are linked with lines of different types. Usually, the straight line connecting two symbols shows marriage, two lines in the middle of it indicate the divorce. When designing a family genogram, begin with the oldest generation of your immediate family you want to represent. For example, grandparents or even great-grandparents, and represent them at the top of the diagram. The youngest generation is placed at the bottom. A married couple is connected with a horizontal line in the genogram and, usually, the male and female are placed on the left and right respectively. The children are placed below the family line from the oldest to the youngest, from left to right respectively.
It is important that sometimes genograms are not limited by family. They can include significant friends and friend relationships. Community genograms, cultural genograms, and other types are also designed. A community genogram shows an entire community, for example, the city starting from its mayor at the top and the managers of different departments and directions at the lower levels. Cultural genograms are used to visualize the ethnic identity of individuals, for example, immigrants.

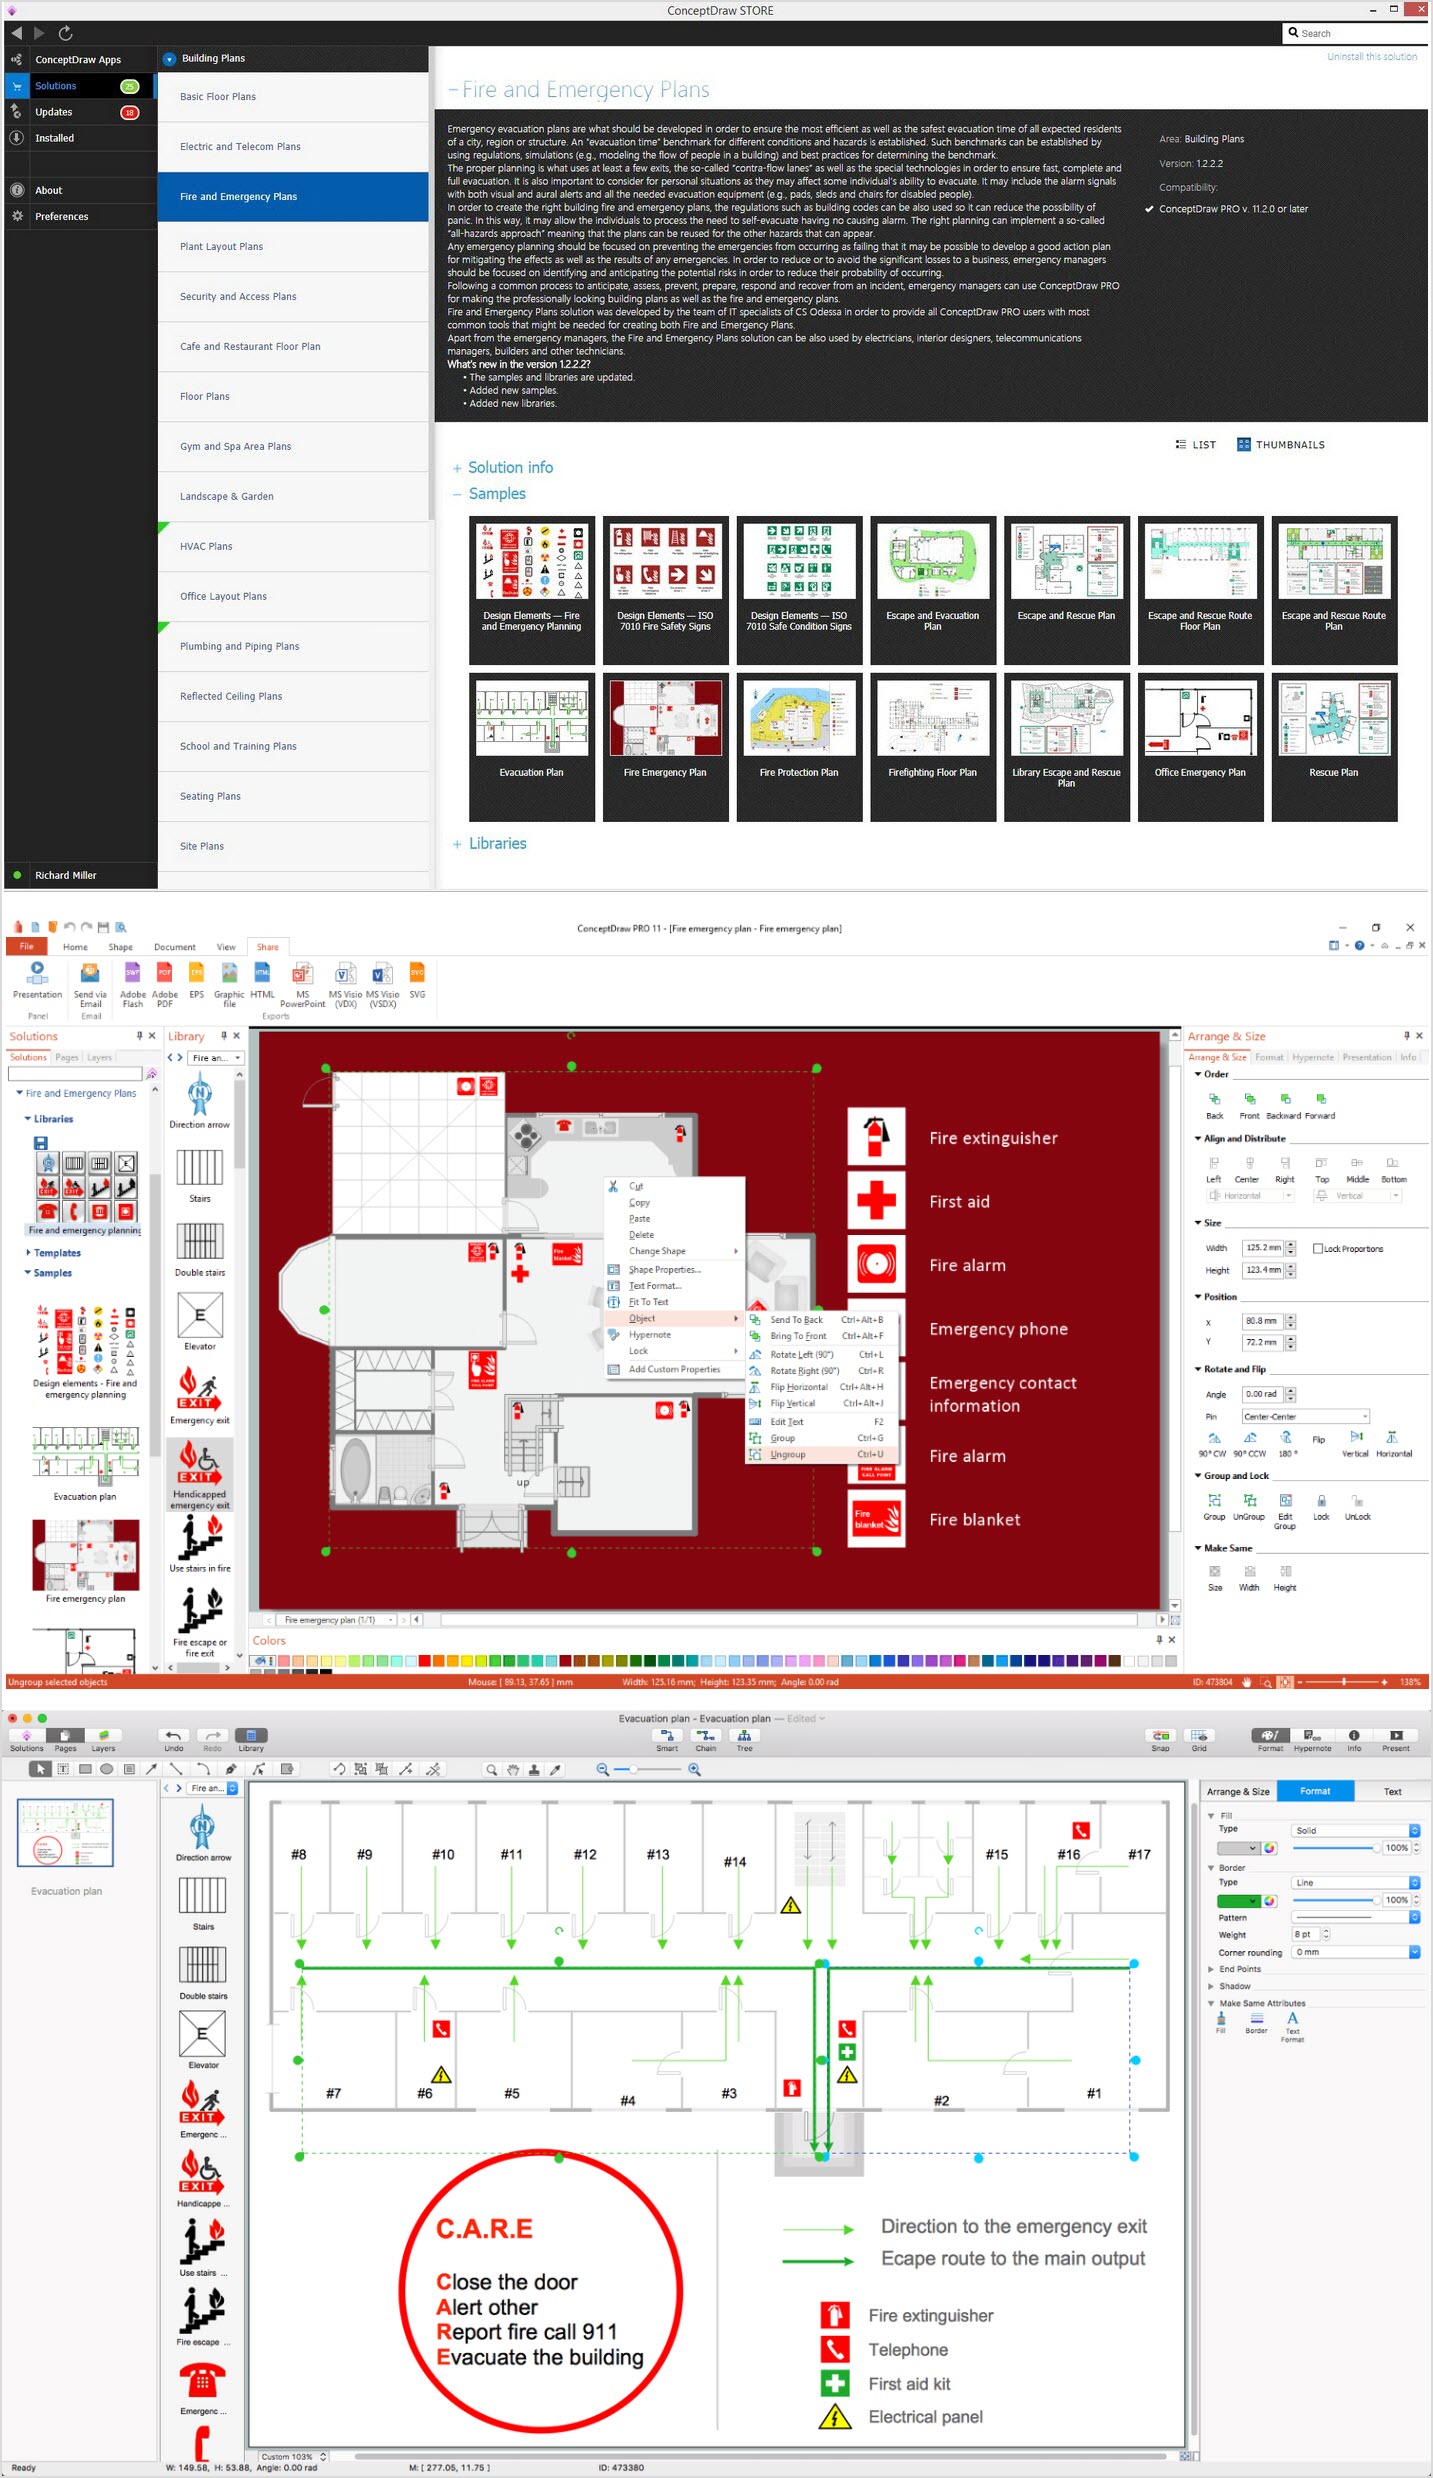
Example 2. Genogram Libraries Design Elements
Genogram solution for ConceptDraw DIAGRAM software offers powerful drawing tools and libraries with numerous vector design elements to create family genograms in minutes. Each family genogram example, sample, and template included in the Genogram solution is useful to be filled with your own data. Visualize efficiently your personal family relationships and history.
Record as much information as you know: names, dates of birth, marriage, divorce, death, and other significant life events. Indicate the gender, lifespan, medical information about serious diseases of ancestors, and other additional information you consider important and want to capture for future generations. These data make your family tree useful for medical staff to trace possible diseases within the family history and prevent them or reduce their impact as much as possible for current and future generations.
Keep track of changes over time and make corrections, if you discover new circumstances. It may be useful to use colors to identify specific family groups within your genogram or indicate the emotional relationships between the family members. Usually, positive relationships are indicated with green lines, bad relationships with red, abusive with blue lines. This gives detailed information about family relationships from a glance.

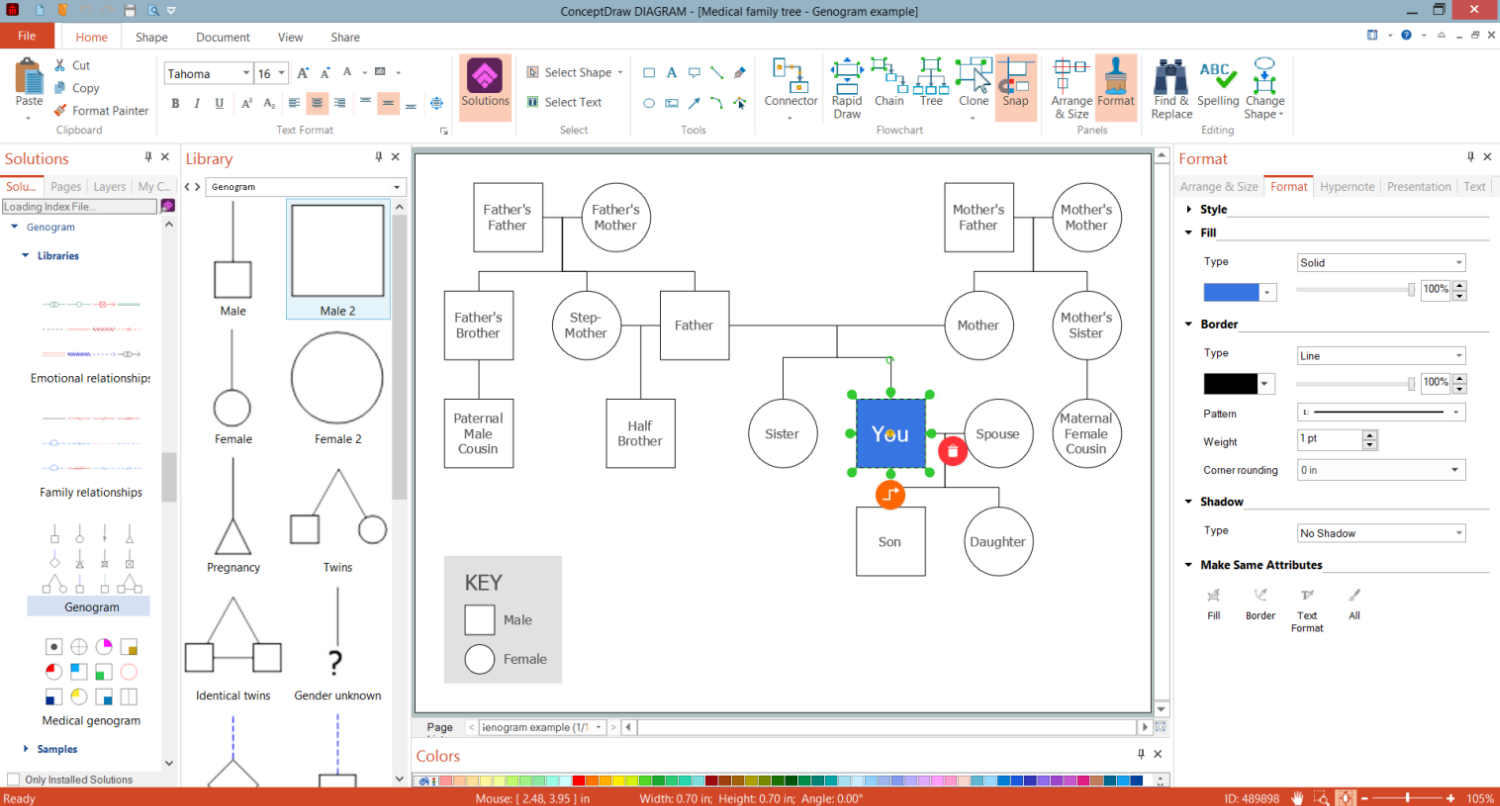
Example 3. Medical Family Genogram
The illustrations you see on this page were created in ConceptDraw DIAGRAM software using the drawing tools of the Genogram Solution. They successfully demonstrate the solution's capabilities and the professional results you can achieve. An experienced user spent 10-15 minutes creating each of them.
Use the powerful tools of the Genogram Solution for ConceptDraw DIAGRAM software to create your own illustrations and diagrams of any complexity fast and easy, and then successfully use them in your work activity.
All source documents are vector graphic documents. They are available for reviewing, modifying, or converting to a variety of formats (PDF file, MS PowerPoint, MS Visio, and many other graphic formats) from the ConceptDraw STORE. The Genogram Solution is available for all ConceptDraw DIAGRAM users.