Sample 1. Audit process flowchart.
ConceptDraw DIAGRAM diagramming software provides vector shapes and connector tools for quick and easy drawing diagrams for business, technology, science and education.
Use ConceptDraw DIAGRAM enhanced with solutions from ConceptDraw Solution Park to create diagrams to present and explain structures, process flows, logical relationships, networks, design schemes and other visually organized information and knowledge.
FIVE RELATED HOW TO's:
Baseball diagram is the simplest way to explain Baseball details. ConceptDraw DIAGRAM software extended with the Baseball solution is an amazing tool for producing and presenting baseball diagrams.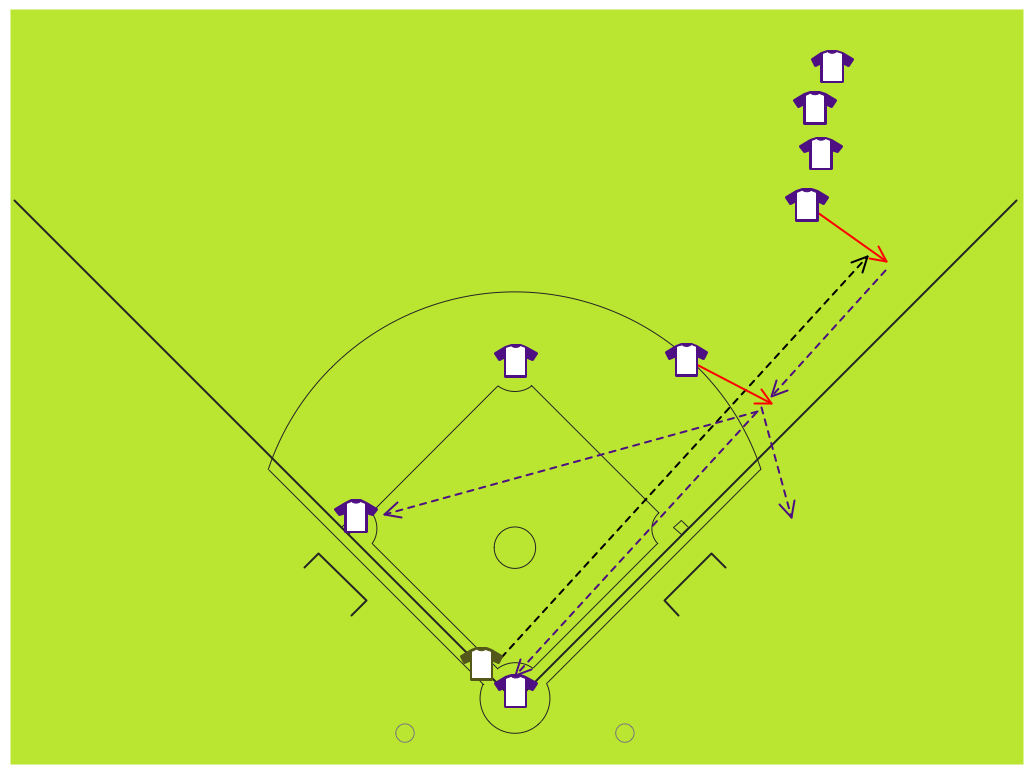
Picture: Baseball Diagram – Fielding Drill – Hit the Cutoff
Related Solution:
ConceptDraw DIAGRAM diagramming and vector drawing software is the best for drawing professional looking Computer Network Diagrams thanks to the network icons from the libraries of Computer Network Diagrams Solution from the Computer and Networks Area of ConceptDraw Solution Park.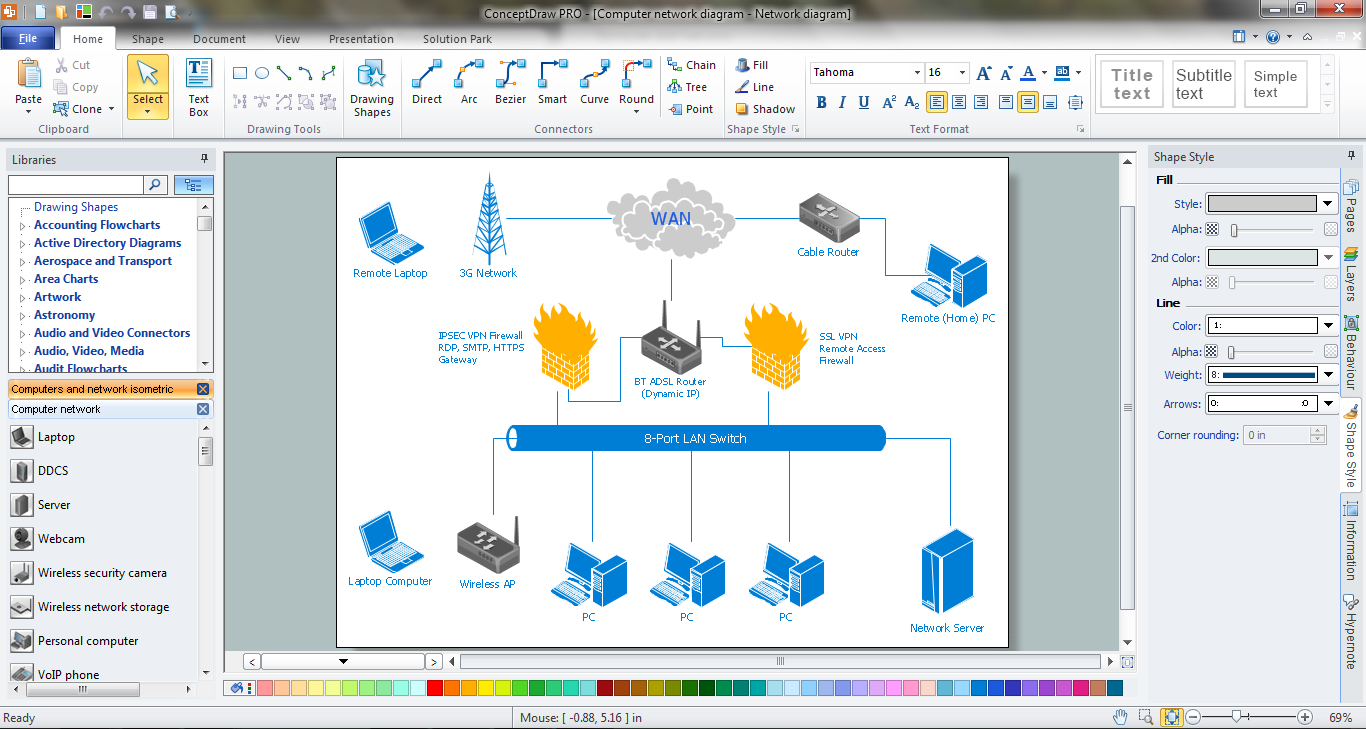
Picture: Network Icons
Related Solution:
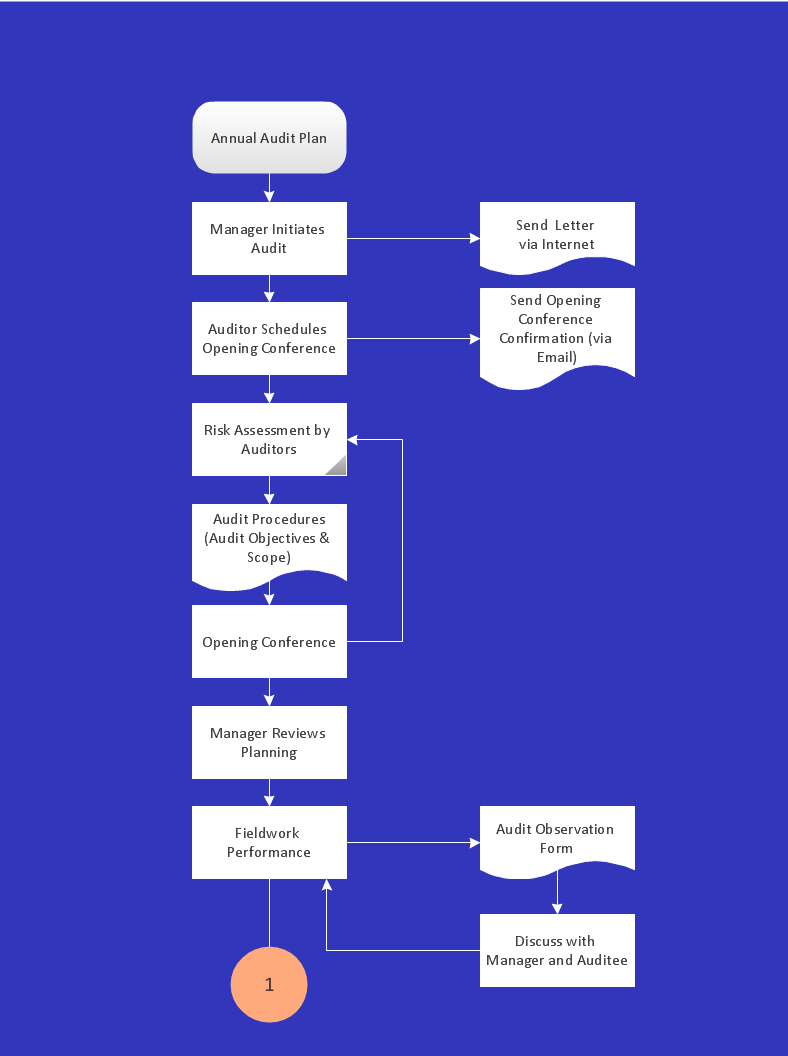
Use ConceptDraw DIAGRAM software as a powerful audit application. 🔸 Create professional Audit Workflow Diagrams and Audit Process Flowcharts to ✔️ plan and implement audit process, ✔️ enhance financial transparency, ✔️ improve financial reporting, ✔️ streamline operations, ✔️ improve business efficiency, ✔️ identify risks and issues, ✔️ prevent financial fraud, ✔️ track progress, ✔️ enhance trust
Picture: Understanding the Audit Process: A Comprehensive Guide. Audit Process Flowchart
Related Solution:
The Soccer (Football) Fields library from the Soccer solution from the Sport area of ConceptDraw Solution Park provides a complete set of predesigned fields: horizontal and vertical located, colored or not, end zone view soccer field.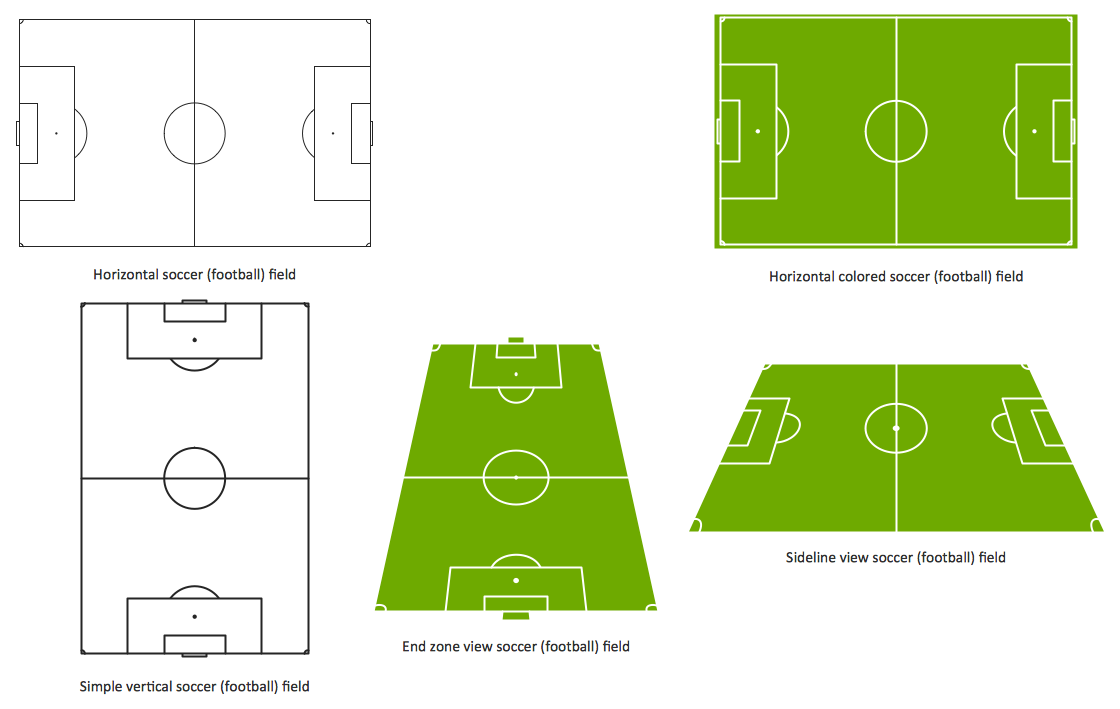
Picture: Design a Soccer (Football) Field
Related Solution:
This sample shows the Flowchart of the ACC general account creation. This Flowchart describes the Start point, the process of the handling the user requests and the End point – creating of the account. The shapes represent the subprocesses and the arrows between the shapes shows the sequence of the actions.
This sample was created in ConceptDraw DIAGRAM diagramming and vector drawing software using the Flowcharts solution from the Diagrams area of ConceptDraw Solution Park.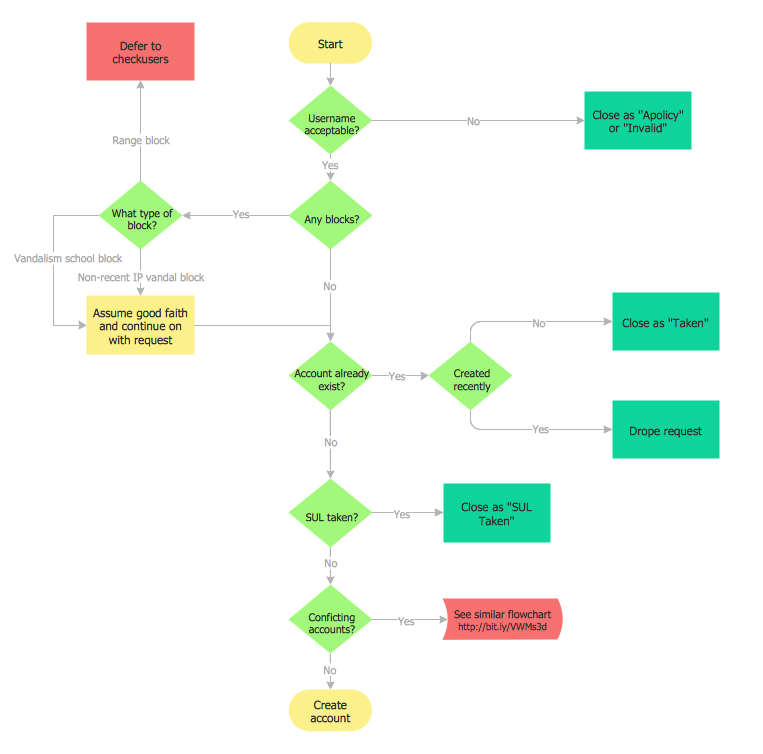
Picture: Examples of Flowchart
Related Solution: